
Changes Team | Rising Water
Project Details
Awards & Nominations
Changes Team has received the following awards and nominations. Way to go!
The Challenge | Rising Water
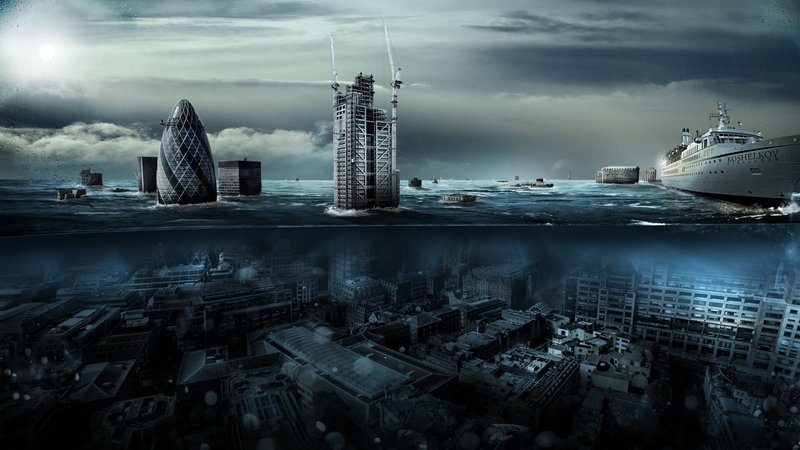
Rising Water
Interactive system that demonstrates the possible consequences of rising sea level.
PREFACE
With our program, we want to increase the awareness of people about the
dangers of CO2 emissions, as well as global warming. We want to make it public
and help people to understand that they must care about our planet.
WHY IS IT IMPORTANT?
Our planet is a wonderful corner in the solar system, which is inhabited by
about a trillion species of living creatures. Over the course of several millennia, mankind has
gradually mastered the depths of this world and is developing in all areas,
influencing the Earth’s ecosystem. Unfortunately, this does not always positively affect our
nature.
Our team has developed an interactive application that illustrates the
changes associated with rising water levels. Already now this will
help to understand how global and serious this problem is that can affect every
person if we do not change our attitude to the environment. Because
under threat not just future generations but maybe we are.
TYPE OF PROGRAM

In the center of the program is a map with which you can observe the change in
water level.
To the left of the map is the «Year»
field. Below is the line where the name of the city is entered. Under the «City
Name» is a field in which information will be displayed on the population, as
well as on the flora and fauna of the selected city.
At the bottom of the map is a
slider with which we can choose the year we need and observe the rise in water
level.
On the right, we also have a slider with the use of which, we lower the level of CO2 and can observe the changes on the map.
HOW DOES IT WORK?
- When moving the lower slider, we select the year of interest to us.
- When moving the right slider, we determine the level of CO2.
- After we set the parameters of interest to us using the sliders, we observe the level of increase in water.
- When you moved mouse on a specific city on the map, we are shown an image of that city.
- If the selected city with the given parameters is flooded, then the level of flooding will be shown in the picture.
- In the line "Name of the city" we can enter the city of interest. And after that we will be provided with information about the population, as well as about the entire flora and fauna, which may disappear (in the process of development).
- YOU ALSO CAN SEE HOW THIS PROGRAM WORK:
DATA USED FROM NASA
Carbon Dioxide
https://climate.nasa.gov/vital-signs/carbon-dioxid...
Global Temperature
https://climate.nasa.gov/vital-signs/global-temper...
SEA LEVEL (TOPEX/POSEIDON)
https://climate.nasa.gov/vital-signs/sea-level/
Air Temperature
https://cutt.ly/AirTemperature
Global Relative Sea-Level Rise
https://vesl.jpl.nasa.gov/sea-level/slr-gravity/
Global Sea Level
https://cutt.ly/global-sea-level
PERSPECTIVE
1) Create a map not only for Ukraine, but also for the whole world.
2) Make a map in 3D format.
3) Add new dependencies on different parameters (similar to CO2
dependence).
4) When you click on a city, a 3D image of the flooded city is loaded.
5) More flooding maps!
DEVELOPED CODE
You can see the developed code for the link:
https://is.gd/0mF9ev