
FireInTheSky| Rising Water
Project Details
The Challenge | Rising Water
The Mechanisms Underlying Sea Level Rise
Sea level rise will occur because land-borne ice sheets will melt, adding water to the oceans, and because warming seawater will expand. An educational dynamic histogram graphic will be constructed to visually depict these effects.
Team Goal: To quickly convert real NASA data into an graphical visualizations and physical models that Joe Public can touch, feel, and readily understand. With these visual aids, we can help to create a larger community of climate-change informed people. Armed with the truth, these people will more confidently hold their ground in the face of rhetoric promulgated by climate change naysayers.
Physical Model of Sea-Level Rise: A 3D contour model of lower Manhattan will be built within a plexiglass tank. We will add some ice to the tank and, by using time lapse photography, show how the melting ice will gradually flood the land. The final video will be posted on a website.
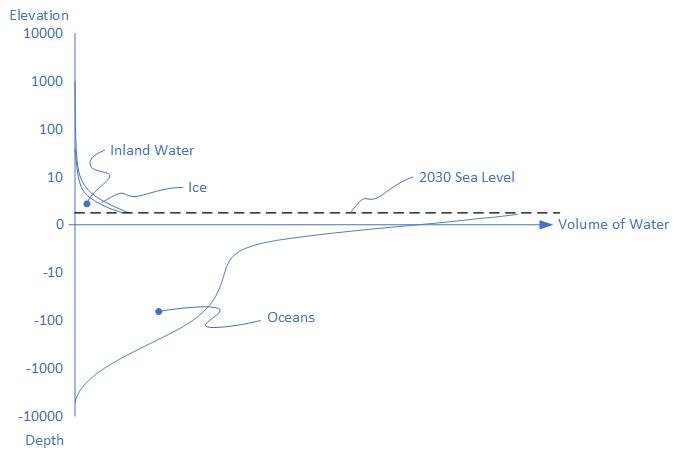
Graphical Visualization of Global Sea-Level Rise: The planned application's output is a time-series of histograms that shows the amount of water (volume and mass) as a function of elevation (relative to the geoid). Animating the time-series will convey how and why sea-level rise is projected to occur. The relative effects of the main two mechanisms (melting ice and sea-water expansion) will be observable in the visualization.
Elevation Maps: Now and After maps that show how sea-level rise will affect Manhattan (our selected major metropolitan area) will be rendered by using Geographic Information System (GIS) mapping data.
Web Page: The video, visualizations, and maps will be embedded into a web page along with well written text explanations. The user will be able to customize the animation by adjusting sliders. Sliders will control the rate of global warming and the degree to which human civilization endeavors to hold back the encroaching oceans by building dykes. The web page is to be hosted somewhere where it will persist for a long time. There will be a statement to the effect that the content is free for public use to encourage Youtubers and influencers to incorporate it into other educational material.
Status Update: We browsed the web for some time before deciding (with advice of an expert) to focus our efforts on https://earthexplorer.usgs.gov/. From the beginning, it proved to be difficult to find and use the data - even with the support of experts who had some experience with such data. Primarily: 1) There are so many repositories of different kinds of data that it is time consuming to find the data we need, 2) It is not straight forward to use the data (assuming one has limited prior experience). For example, there were high-friction registration steps (with surveys built in) needed to access the data. In one case, 100 individual tiles of data had to be manually downloaded to achieve the desired global coverage. In most cases a lot of reading was needed to assess whether or not a particular data set would ultimately be useful for the application. Many data sets reported (or displayed) that they supported only partial coverage. (Note: A rating system that would cause the most useful data sets to receive more stars and the best reviews from prior users might help.)
Something else that would help to address the issues we experienced would be a set of ~100 easy-to-browse sample applications (see https://d3js.org for an example of such a set). These samples should demonstrate how other people solved some typical data visualization and analysis problems. A new person could then browse through the samples to find one that would serve best as a starting point for their own project.
We did find something that we think might be useful - but it's comes from the ESA and CNES (http://www.altimetry.info/filestorage/Radar_Altimetry_Tutorial.pdf).
GitHub Link:
YouTube Video Link: https://www.youtube.com/watch?v=IwVmq1gJx0Q&feature=youtu.be