
IES Coders| Rising Water
Project Details
The Challenge | Rising Water
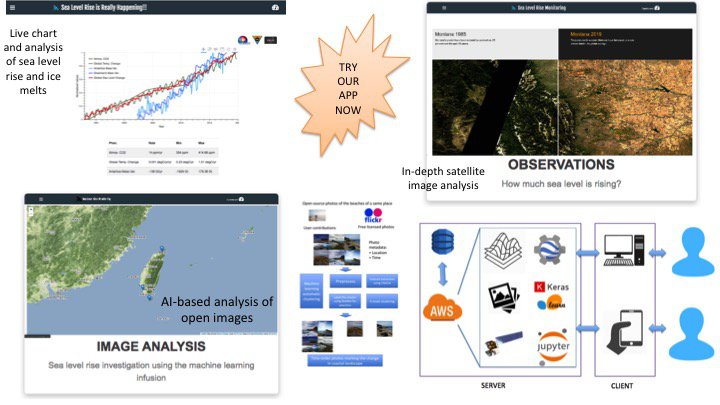
Sea Level Rise Is Really Happening
Sea Level Rise Is Really Happening is an web app that helps people to look at sea level rise from multiple approaches: past, present and future, from sea level causes to the changes in the coastal area, land loss and environment indicators.
Link to app: http://slrm.herokuapp.com
Source code
Github code for crawling data and clustering: https://github.com/nghia1991ad/nasa_photos
Satellite data analysis examples: https://gist.github.com/qAp/04d13fed7c2103b039686de26b915e11
App code: https://github.com/earthinversion/slrm_source_code
Presentation:
BACKGROUND
Although be considered as a big threat to human, sea level rise might be underestimated due to its slow effect. However, the sea level rise is a consequence of global climate change, which is partly contributed by human activities. Therefore, rising awareness about sea level rise and climate change is the top priority to prevent the effect of it.
SOLUTION
We introduce our web app Sea Level Rise Is Really Happening, a visualization tool that provides knowledge of sea level rise from different approaches. The web app provides a friendly interactive interface for user to discover the causes and facts about sea level rise at a global scale. Then we focus on the effects of sea level rise to the ocean and land at regional scale (Asia and Pacific) to local scale (coastal area of Taiwan). Through multiple viewpoints, we hope to convince the users how small change of sea level rise yearly can accumulate to dramatic change over decades.
Ice melts and sea level rise
We plot the correlation between ice melts and sea level rise through the year. This plot helps the user to have the knowledge about the causes of the sea level rise. We have now-and-before photos of snowy mountains that lost ice quite considerably in though decades.
Sea level change effect
We provide the visualization of various indicators that could be the consequence of sea level rise, including: Surface Sea Salinity (SSS), Surface Sea Temperature (SST), Chlorophyl concentration and Liquid Water Equivalent Thickness plotted in global and regional scale.
Photo cluster analysis
Everyday thousands of photos were taken at the coastal areas, which might be a great resource to see the coastal changes caused by sea level rise. In these photos, there could be markers (rocks, a house, an island, etc.). We applied machine-learning clustering to free-licensed photos taken at the coastal areas (Flickr API and user contributions) to show the changes of sea level compare to the markers.
The machine-learning clustering include:
+ Preprocessing and resize image
+ Feature extraction using pre-trained model VGG16 and dimension reduction using Principle Component Analysis (PCA)
+ K-mean clustering and label the cluster using ResNet
The users can also contribute photos they have to each location and become a sea level rise observer (how nice to be a scientist!).
We take three coastal locations in Taiwan as examples of this approach: Kenting beach, Yehliu Geopark and Helping Island Geopark. Through the demonstration, we hope the analysis can be applied to any other coastal area in the world.
Satellite analysis
We collect the satellite images from Landsat L5, L7, L8 and S2 of various places which are predicted to be most vulnerable from sea level rise, including: Mekong Delta (Vietnam), Ganges Delta (Bangladesh) and Papua New Guinea.
Projection of sea level rise consequence
Using the satellite images and DEM data, we plot the future view of different cities and areas when the sea level rises from low 0m to a maximum high of 15m. As consider the long term evolution of the Earth, there are evidences showing that the sea level in the past could reach that high (DeConto and Pollard, 2016) and up to 20 m about 400.000 years ago (Petit et. al., 1999). The projection shows a large amount of land area will be submerged in the water, even if the sea level rise of 1 m.
Current research catalog
We also update and allow people contribute the knowledge by adding the information for the published paper about sea level rise.
RESOURCES
Data
- NASA climate change and sea level change portal: https://climate.nasa.gov/ & https://sealevel.nasa.gov/
- Satellite images from Landsat L5, L7, L8 (https://landsat.gsfc.nasa.gov) and Sentinel-2 (https://www.esa.int/Applications/Observing_the_Ear...) access through Google Earth Engine
- Free-licensed photos from Flickr https://www.flickr.com/
- NASA Soil Moisture Active Pass: sea surface salinity and temperature https://podaac.jpl.nasa.gov
- NASA Chlorophyl concentration https://neo.sci.gsfc.nasa.gov/view.php?datasetId=MY1DMM_CHLORA
- IPCC report https://www.ipcc.ch/reports/
- Shuttle Radar Topography Mission (SRTM) Digital Elevation Model
- NASA GRACE gravity satellite (https://www.nasa.gov/mission_pages/Grace/index.html)
Tools and techniques
- Amazon Web Service
- Google Earth Engine
- QGIS
- sklearn library: pretrained model VGG16 and ResNet50 (and references therein)
References
DeConto, R. M., & Pollard, D. (2016). Contribution of Antarctica to past and future sea-level rise. Nature, 531(7596), 591.
Petit, J. R., Jouzel, J., Raynaud, D., Barkov, N. I., Barnola, J. M., Basile, I., ... & Delmotte, M. (1999). Climate and atmospheric history of the past 420,000 years from the Vostok ice core, Antarctica. Nature, 399(6735), 429.