
Lakeside| Rising Water
Project Details
The Challenge | Rising Water
Time machine of sea level
This is a website where you can clearly see the changes of sea level as well as other environmental datas over the decades.
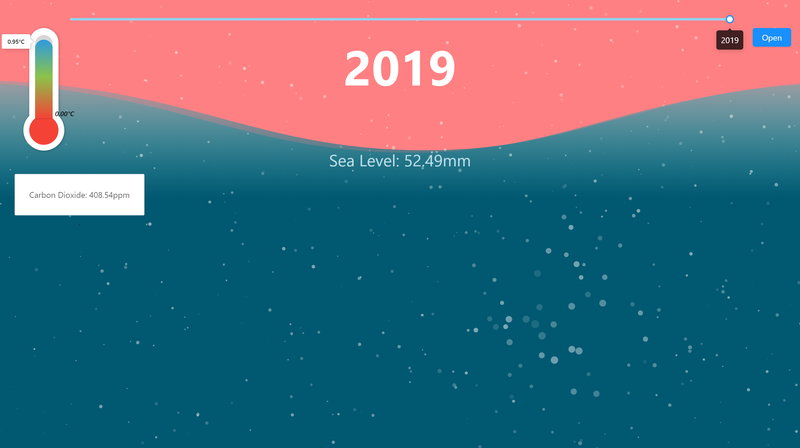
This visualization project is based on the topic “Rising Water”. It is called “Time Machine” . The main consideration of this project is to visualize the changes of sea level from year 1993 to 2019 along with other environmental parameters such as temperature and the concentration of CO2.
The data was from NASA Goddard Space Flight Center including sea level, concentration of CO2, and temperature. We'd like to take more variables into consideration and view the impacts on the sea level in the future. And we could also use some machine learning technologies to process the data and discover the inner relationship inside the data.
We mainly use ReactJS to develop a visualization tool along with some other visualization tools and libraries.Out GitHub link is https://github.com/liust97/sea-level-visual.
#ReactJS #Javascript #CSS #website #visualization