
Planeta Água| Rising Water
Project Details
The Challenge | Rising Water
Planeta água: a collaborative game to demonstrate impacts of our decisions on increasing the level of ocean water
Some of our children and grandchildren are going to die! It's not what I do today that's going to change that, we need to do different for 100 years and it's not what you and I do that changes it, that's what everyone will do for the rest of their lives!
Project repository:
https://github.com/ygordlp/planetaagua.git
The game site was developed using html, javascript and css. Some frameworks and libraries, such as bootstrap, have been used to facilitate their creation.
Two NASA databases were used to understand ocean level developments and rising temperatures:
- NASA and NOAA Altimetric and Ocean Surface Topography Data Information;
- GISS Surface Temperature Analysis (GISTEMP v4) (https://data.giss.nasa.gov/gistemp/).
Using NASA data and using Facebook's Prophet prediction library, we find prediction values for level and temperature rise over the next 5 centuries. This prediction was developed in python using the free Google Colab tool.
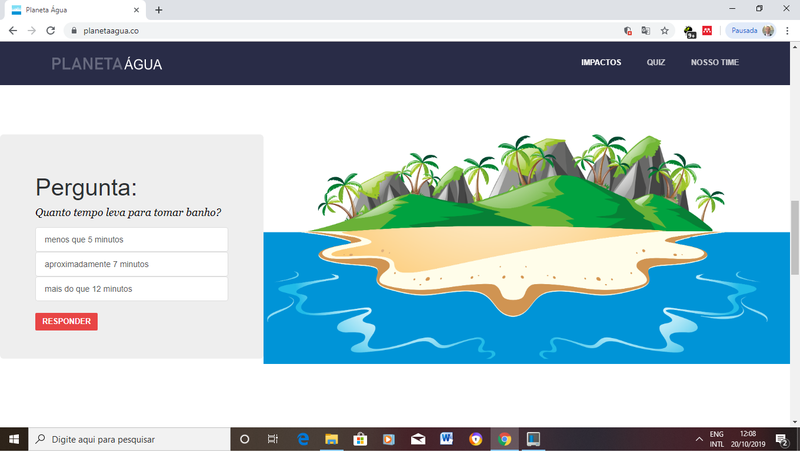
In the game, the user answers questions that feed into a database created with Google Sheets. Each set of 5 questions defines what will happen to the island's image over a century. Every 5 questions answered, the user receives the result of their choices and the overall result, which defines the image update.
The interface between the database and the game works with the https://sheet.best tool, which creates a rest API and interface with Google Sheets. To find the individual and overall result, each answer has a score in the database. The score grows as the response approaches a more conscious attitude. The final result is presented as a percentage comparing the sum of the maximum score that could be obtained from the sum of the actual score.
In addition to several visual and technological improvements in the game, the worldwide impact can be achieved through the engagement of schools, teachers and students. Teachers, researchers, and people involved in the cause can submit questions, questions can be evaluated by the users themselves. Better questions and better scorers can receive monthly, annual awards to help engagement.
Another very important question is how response data can be used. While our current product does not use this information, the region, user profile, and other relevant information may be used to define the awareness of people, regions, cities, and countries about the issue. Assessments of these contexts may suggest local, regional and global actions aimed at improving people's awareness.
References:
* GISTEMP Team, 2019: GISS Surface Temperature Analysis (GISTEMP), version 4. NASA Goddard Institute for Space Studies. Dataset accessed 20YY-MM-DD at https://data.giss.nasa.gov/gistemp/.
* Lenssen, N., G. Schmidt, J. Hansen, M. Menne,A. Persin,R. Ruedy, and D. Zyss, 2019: Improvements in the GISTEMP uncertainty model. J. Geophys. Res. Atmos., 124, no. 12, 6307-6326, doi:10.1029/2018JD029522.
* JPL MUR MEaSUREs Project. 2010. GHRSST Level 4 MUR Global Foundation Sea Surface Temperature Analysis. Ver. 2. PO.DAAC, CA, USA. Dataset accessed [2015-11-05] at http://dx.doi.org/10.5067/GHGMR-4FJ01.
* Frank Wentz, Simon Yueh, Gary Lagerloef. 2014. Aquarius Level 3 Sea Surface Salinity Standard Mapped Image Annual Data V3.0. Ver. 3.0. PO.DAAC, CA, USA. Dataset accessed [2015-11-05] at http://dx.doi.org/10.5067/AQUAR-3SAPS.
* Physical Oceanography Distributed Active Archive Center (PO.DAAC). 2015. Firefox ESR v38.4.0 Web Page. Available online [https://podaac.jpl.nasa.gov/] from NASA EOSDIS PO.DAAC, Pasadena, CA, Accessed November 5, 2015.