
Water Matters| Rising Water
Project Details
Awards & Nominations
Water Matters has received the following awards and nominations. Way to go!
The Challenge | Rising Water
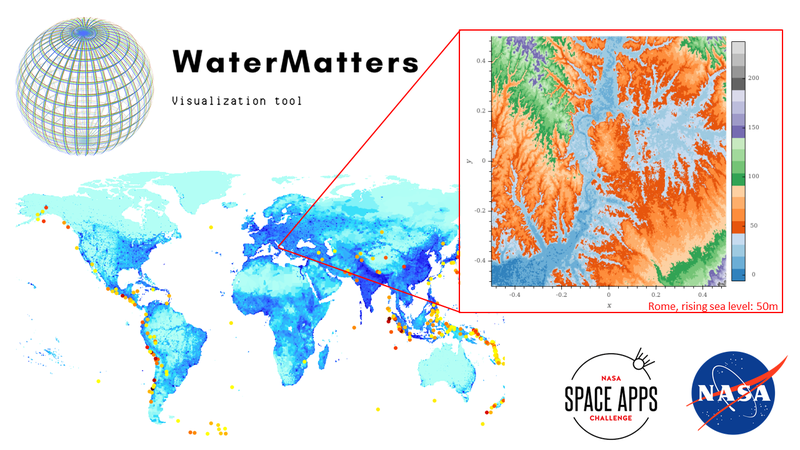
WaterMatters
WaterMatters shows you how the world map will change over time due to rising sea levels and what would happen if we were able to reduce the rate of increase.
Background:
Sea levels are rising as a consequence of Global Climate Change, this will affect the distribution of land areas and, therefore, all the organisms that inhabit both water and terrestrial media. All members of the WaterMatters team come from different cities but all are located in coastal areas, which makes us especially aware of this cause. One day we found an illustration that went viral on social networks which tried to represent the Europe of 2050 by outlining the map to show the flooded areas. Although the idea was good, this illustration did not faithfully represent reality, since according to it mountainous areas such as the Pyrenees (Spain) were flooded in the same way as flat areas such as Venice (Italy). So, we thought we could create a realistic map showing the areas that would be flooded taking into account the elevation of the land, the accessibility of water and other scientifically proven parameters.
What it does:
This tool allows visualization of climate change effects having into account scientific parameters, terrain elevation, orography and water accessibility. The user can visualize, in this way, the evolution in the selected time if the parameters are maintained as they are estimated nowadays. The novelty that this application represents and what the endowment of didactic capacity is the fact that the user can select to vary the constant "annual increase in sea level". Thus, it would be possible to observe not only what would happen if the sea level continues rising within a few years, but what would happen if we managed to reduce the rate of increase.
In the same application we would like to provide the user with the actual data used to generate the map and facilitate contact with international and local NGOs that are directly or indirectly dedicated to reducing the human impact on climate change.
NASA Resources:
Our application is based on a Python code in which we have used the global datasets SRTM 30m Global 1 arc second V003 elaborated by NASA and NGA hosted on Amazon S3 and SRTM 90m Digital Elevation Database v4.1 elaborated by CGIAR-CSI. To access them we have used the package elevation 1.0.6.
Future Plans:
After laying the groundwork for the general idea of this project, we think of countless ways to improve it by introducing layers on the map. Some of these ideas are aimed at separating the parameter sea level increase in percentages that have been scientifically proven to represent it; for example, quantify the direct action of the emission of certain pollutant gases on the rise in sea level and allow the user to check what would happen if we reduce these emissions. Other parameters to consider would be the consumption of single-use plastics or vehicle emissions.
On the other hand, taking into advantage that we can calculate the estimate of sea temperature over time, and two WaterMatters members are Biologists/Biotechnologists, we could introduce a layer indicating which marine and terrestrial species (plants and animals) would be displaced and even extinct.
Finally, our project already includes the promotion and facilitation of contact with NGOs whose mission is to try to reduce the effect of humans on sea level rise. A very interesting future perspective would be to add a layer on the map where users could observe specific points that indicate where the headquarters of these organizations are located or where they could collaborate.
Built:
In order to visualize and in a near future integrate more data to the application, we used python3-based code to display the topography and how hill change based on the sea level rising. The topology data is downloaded using the elevation module that uses GDAL command line tools to download the selected area in SRTM 30m DEM database.
In order to enhance the use of bigg arrays, NumPy is used. To display the data, matplotlib and holoviews libraries are used. Finally, once the images are created, imageio(that uses PIL funcionalities) is used to compress all data in a one stand-alone .gif image.
How the increase of sea level is simulated is by changing cmap center point (that normally is 0). This is done thanks to the MidPointNorm class reported by tillsten.
Try it out:
You can find the code for an example (in this case Rome city (Italy)) in GitHub:
https://github.com/Water-Matters/Space-Apps-Challenge-2019
This code can be extrapolated to other cities, the map could be modified and show different locations.
Tags:
#Visualization tool, #Map, #Ocean, #Sea level, #Python, #Earth, #Climate change, #NGOs, #Land surface, #Flood, #Water temperature, #Solid Earth