Bloom Tide| To Bloom or Not to Bloom
Team Updates
Final Step
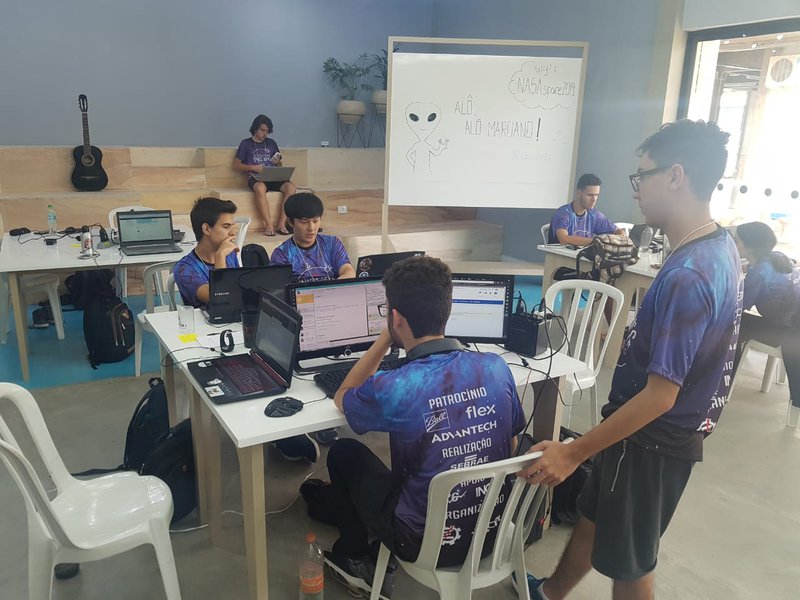
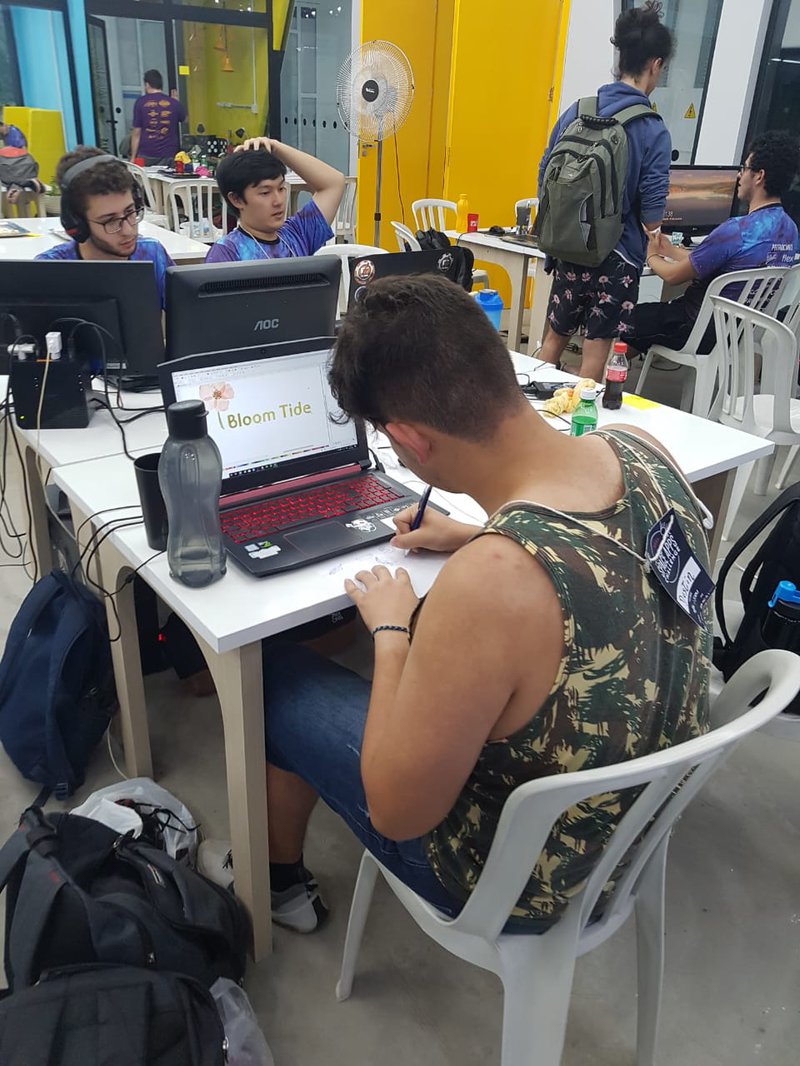
The last hour of blooming ideas has begun! Our team is very happy and proud about our job!!
the final countdown
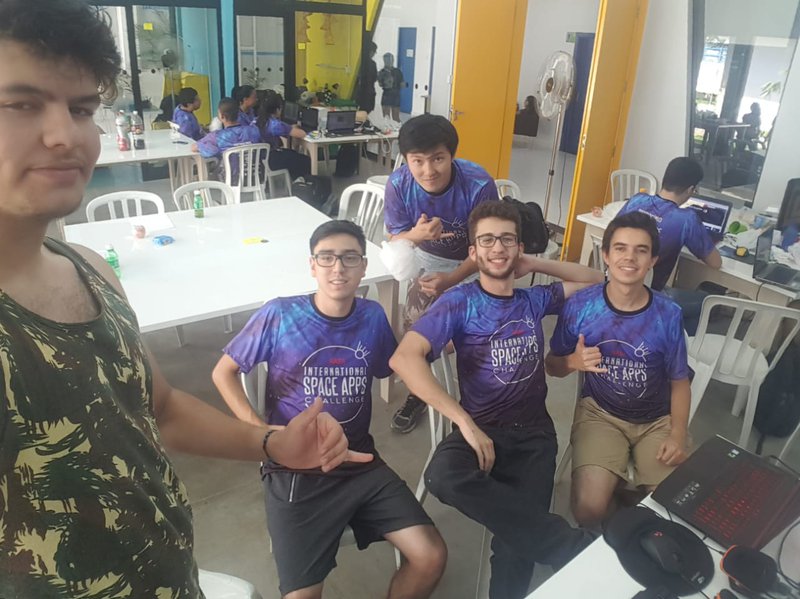
Just some updates, we've finished our pitch presentation and training, now, it's time to get the code ready and wait the final presentation!
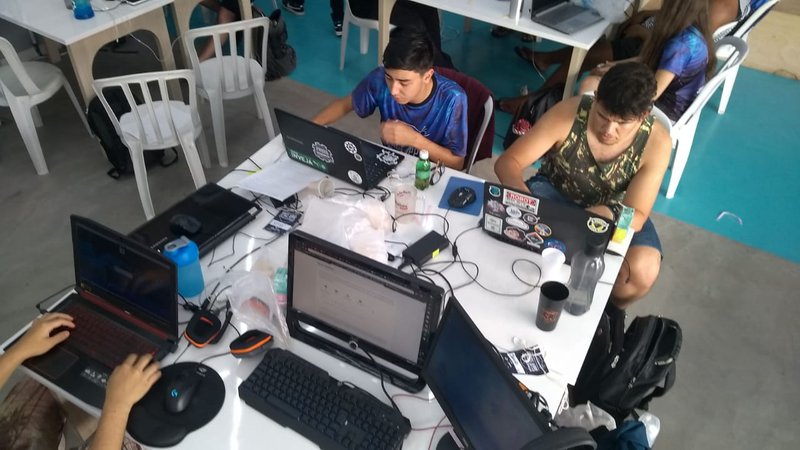
another day, another challenge
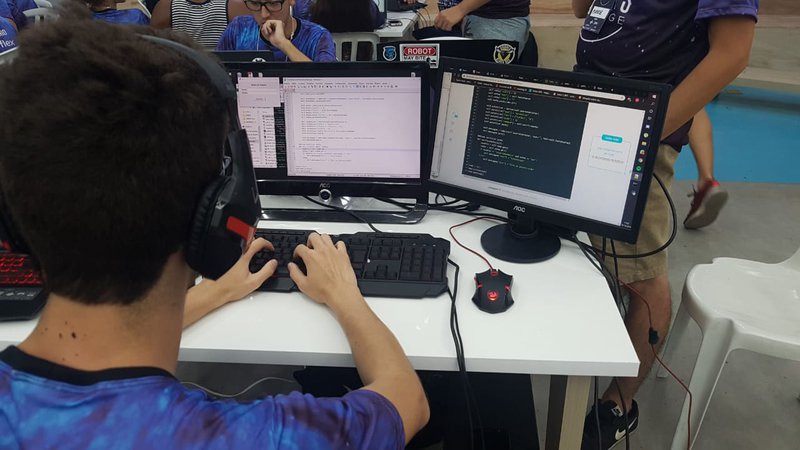
Starting the last day of the challenge, we made great progress at dawn and started training the pitch and polishing our code to plot the best map we can do!
Some of the problems we've encountered was the integration of the maps and some problems working with coordenating the datasets but a little bit of coffee and discussion led our way to a solution.
A NEW START
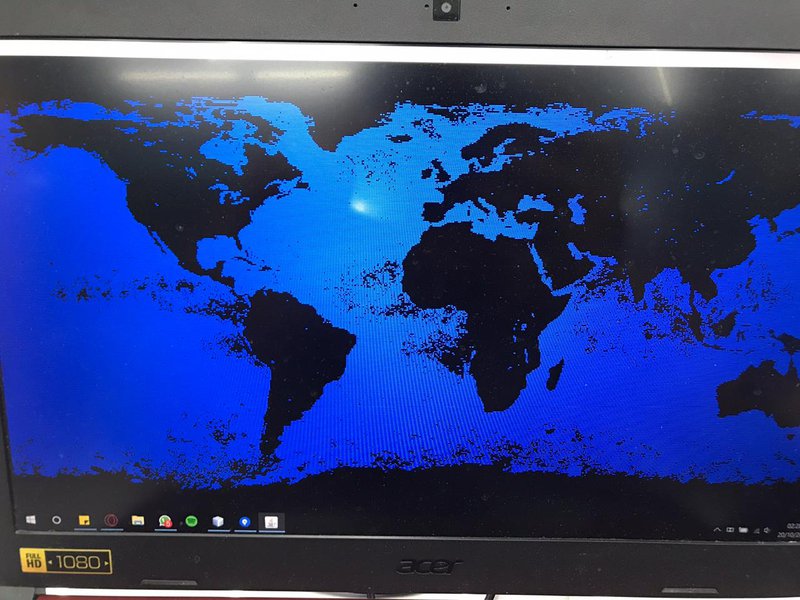
Now, we are concentrating our efforts in two things, improve our map with colors and other data, while we are closing the ends in relation with the pitch, searching a few details to a better presentation.
We still have left 13 hours to deliver the slide presentation and a lot to do.
LET'S GO!

THE FIVE PARAMETERS
After some research, we've linked some studies over the world in articles about the many reasons that Harmful Algal Blooms (HABS) occurs. According to Indiana University, some of the most principal causes of algal blooms until then was the quantity of nutrients in the water, such as phosphorus and nitrogen, coming from the landscape, by fertilized agricultural areas, etc. But it is not the only cause, there is also the seasonal increase of temperature, creating favorable conditions, light conditions, increasing and in some cases, decreasing the population of cyanobacteries, stable conditionsin the environment, like low flows, long retention times, light winds and minimal turbulence and turbidity as a indicator, because when turbidity is low, it means that there is a slow moving or stagnant water, creating a stable condition.

Analyzing and connecting the information
Second Step:
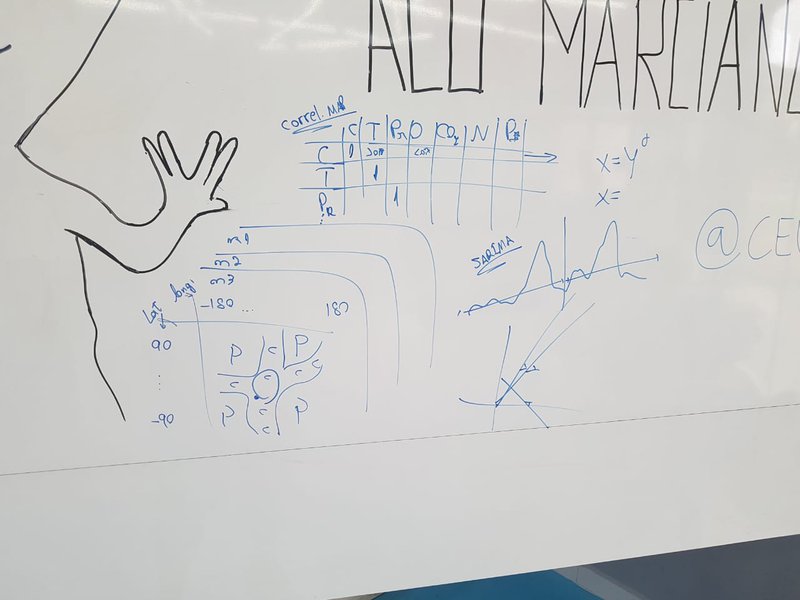
We are now trying to analyze some ways to get Chlorophyll Concentration,Sea Surface Temperature, and other datasets from Nasa Earth Observation.
With this Chlorophyll Concentration we can try to develop a Correlation Map, with other variables like carbon monoxide concentration, temperature and etc. And with this Correlation Map we will trace the relation of each variable.
STARTING THE PROCESS
The first step our team has been woking on is to search, understand and gain ground about the problem! We are trying to analyze local patterns that can be scaled to whole world.
Also, we are working on 3 parts:
- Find specifics causes on our selected area;
- Connecting the causes with the consequences;
- Find ways to avoid big damage to the local fauna and flora and to the population !