
Project Details
Awards & Nominations
NASATR has received the following awards and nominations. Way to go!
Global Nominee
The Challenge | To Bloom or Not to Bloom
Your challenge is to solve the mystery behind algal blooms! What factors cause blooms in some water bodies but not others, and how can we better predict their occurrence to prevent harm to aquatic and human life?
MARINA
We are heading to solve or at least predict through the development of an app, the natural and anthropogenic impact of the eutrophication phenomena in water bodies that could lead to environmental problems.

BACKGROUND
INTRODUCTION
- There is currently a widespread concern about the populationincrease, which directly impacts the environmental assets andresources needed for a sustainable future. Although population growthrates are slowing down, in the year 1970 it reached 2.09% whichgradually decreased until reaching 1.16% in 2017 (World DevelopmentIndicators), the possibility of exceeding the carrying capacity ofour planet is a possible scenario (Motesharrei et al., 2014). It isestimated that in sub-Saharan Africa and South Asia, agriculturalproduction should increase more than double by 2050 compared to 2012levels, while in the rest of the world, the projected increase wouldbe approximately one third (Food and Agriculture Organization of theUnited Nations, 2017).However, the intensificationof agriculture, industrial development and other anthropic activitieshave increased the demand for natural resources and contributed toair and water pollution.(Mareida andPingali, 2001; Nelson and Mareida, 2001).
EUTROPHICATION
- The breakdown of the balance of a planktonic ecosystem based on the variation of
natural conditions of temperature, luminosity or nutrient availability can
cause an exaggerated proliferation of algae. Such proliferation can lead to problems
specific as the decrease of dissolved oxygen during the night, or more general if the
decomposition of dead algae depletes oxygen. Increase of turbidity, increase of
pH, the generation of toxic substances by some microorganisms, among others, are
important consequences of eutrophication processes. The solution of the problems of
eutrophication is mainly due to the limitation of the entry of main nutrients
(mainly phosphorus) and the elimination of those present in the sediment. (Monerris and Domenech, 1995)
San Roque Lake, Códoba, Argentina. (Sentinel II)
VISION
- That is why we developed an app based on the Lake Reactor model to be able to predict phosphorus concentrations as a function of time and estimate, among other variables, the maximum phosphorus support capacity of the system, to be checked by using satellite information , if the areas of influence comply with such limitations.
THE TEAM
- Our team is made up of a biologist, an agronomist and a biochemist. The three of us are PhD students from the University of Buenos Aires and we have basic programming skills, mainly in Python, which allowed us to develop our idea.
THE MODEL
- To estimate the total phosphorus as a function of time, we apply the differential equations described in the Reactor Lake Model.
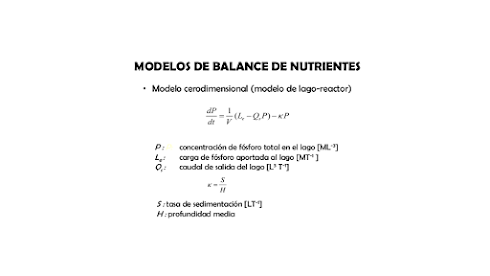
- Once the phosphorus concentrations is estimated, the app allows you to select between three empirical relationship options (Toman and Mueller, 1987), which calculate the chlorophyll concentration based on the total phosphorus concentration and thus determine the condition of the lake (Eutophic, Mesotrophic, Oligotrophic).
Empirical relationship between PT and CHL
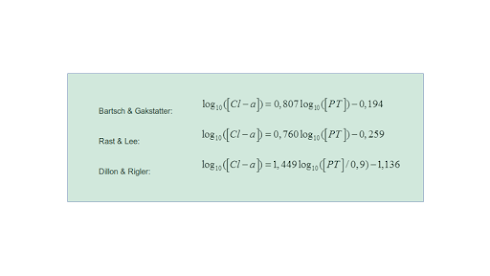
- One of the critical variables of the model is the estimation of phosphorus entering of system. Using EOSDIS Worldview tool we can determine the anthropogenic activities in the area of influence to estimate the phosphorus contribution.
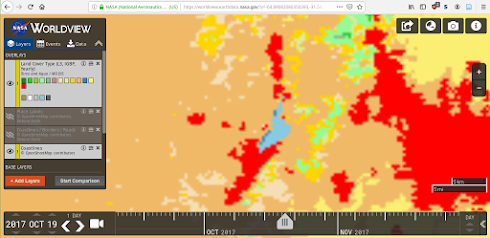
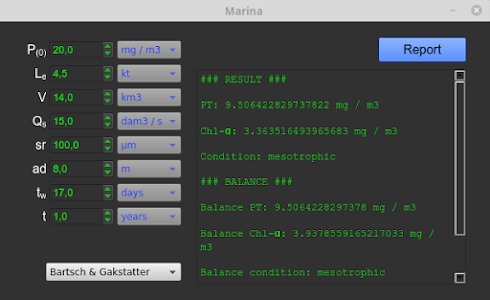
THE APP
- The app was developed in python3 and the following libraries were used: 1) sys. 2) math. 3) PyQt5. 4) matplotlib. 5) numpy
- INPUT: Initial phosphorus, System phosphorus entry, Volume, Flow, Sedimentation rate, Average depth, Time spent in the lake and Time
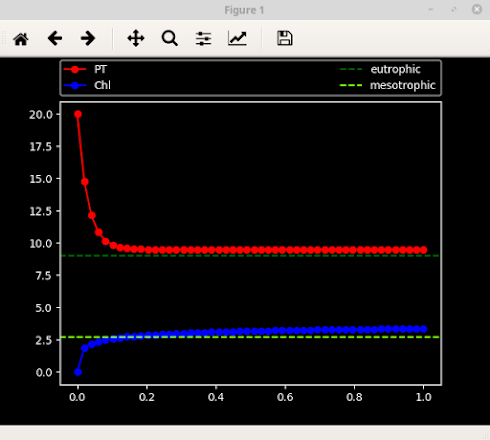
- OUTPUT: PT(t), Chl(t), Lake condition(t), PT(eq), Chl(eq), Lake condition(eq), Maximum PT Capacity. it also launched a graph corresponding to the concentration PT and Chl as a function of time.
BLOG:
https://nasatr2019.blogspot.com
(Fragment) CODE & DEMO
ALTERNATIVE LINK TO THE PRESENTATION VIDEO:
RESOURCES
- Worlddevelopment indicators. Washington, D.C. :The World Bank.
- Motesharrei, S.,Rivas, J., Kalnay, E., 2014. Human and nature dynamics (HANDY):Modeling inequality and use of resources in the collapse orsustainability of societies. Ecol. Econ. 101, 90–102.https://doi.org/10.1016/j.ecolecon.2014.02.014
- Food andAgriculture Organization of the United Nations (Ed.), 2017. Thefuture of food and agriculture: trends and challenges. Food andAgriculture Organization of the United Nations, Rome.
- Mareida, M.,Pingali, P., 2001. Environmental Impacts of Productivity-EnhancingCrop Research: A Critical Review. Doc. No. SDR/TAC:IAR/01/14 presented to the Mid-Term Meeting, 21-25 May, Durban, SouthAfrica.
- Toman, R.V., Mueller, J.A., 1987. Principles of Surface Water Quality Modeling and Control. Harper Collins Publishers.
- Salas, H. and Martino, P. 1991. A simplified phosphorus trophic state model for warm-termal tropical lakes. Water Research.
- Monerris, MM and Doménech, PM. 1995. Modelación de la calidad del agua.
- EOSDIS Worldview: https://worldview.earthdata.nasa.gov
"The greatest need of the human race is a balanced ecology. The greatest heritage of the human race is a restless mind."
Isaac Asimov.