
Planet Express| From Curious Minds Come Helping Hands
Project Details
The Challenge | From Curious Minds Come Helping Hands
Your challenge is to design and build an innovative platform to integrate satellite data and information about vulnerable populations and environmental hazards in order to identify the most at-risk populations. Be creative and think outside the box. How will you identify those people that are often missed, but need aid the most?
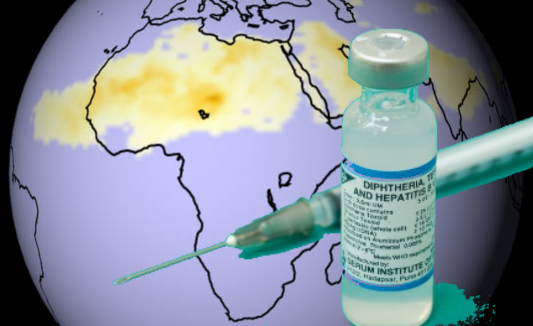
Satellite-aided disease hazard identification
Our goal is to find the most vulnerable populations in Nigeria, looking for those lacking the DPT vaccine and the factors which might help spread these bacteria, such as a high aerosol index.
We used data from the NASA at https://worldview.earthdata.nasa.gov to get the aerosol index in Nigeria, and information from worldpop.org to get the population density and the DPT vaccionation coverage of the region, all three of them in Geotiff format.
Using both MATLAB and python with the matplotlib, numpy and rasterio libraries, we loaded the raster images and converted them to numpy arrays, to then use an evolutive algorithm to find the weighed areas which represent the regions at the highest risk of infection spread.
Resources used:
worldview.earthdata.nasa.gov
https://www.worldpop.org/geodata/summary?id=6160
https://www.worldpop.org/geodata/summary?id=17020
Link to project: