
Project Details
Awards & Nominations
Shaman has received the following awards and nominations. Way to go!
The Challenge | From Curious Minds Come Helping Hands
Shaman
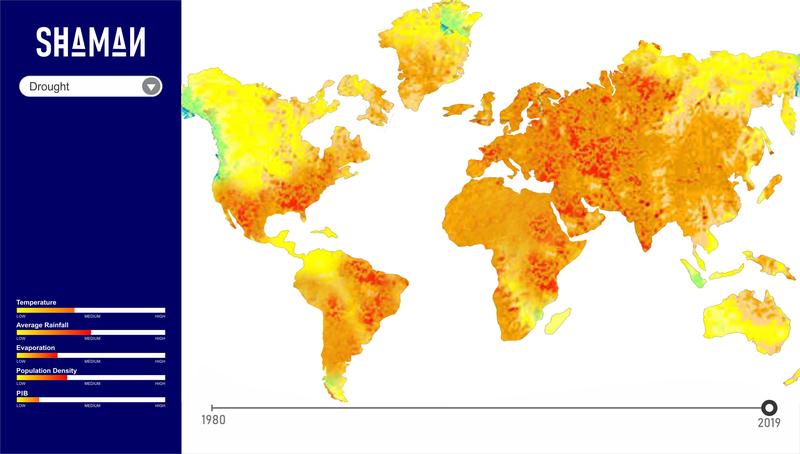
The Shaman project is a web platform with an interative map that, through artificial intelligence, aims to identify vulnerable communities at environmental risk and allows any user to easily access these information.
About us,
Shaman - The true balance between human being and nature to save lives.
Gefferson Ferreira, Civil Engineering
Lucas Brabec, Computer Science
Rafael Barbosa Conceição, Computer Science
Victoria Lima, Graphic DesignWilson Carvalho, Computer Science
SECTION 1: WHAT IS SHAMAN PLATFORM?
Shaman is a scalable platform that through feature exploratory analysis, making use of crossed data sets with its locally gathered data, verifies whether a chosen locality is in risk of environmental disaster. Additionally, it allows any user to access easily understandable visual content. Therefore, Shaman provides useful and valuable information to the competent authorities in order to take better safety measures and prominent decisions to reduce property damage, rescue people and save lives.
As a supporting data, 25% of deaths worldwide are known to be linked to environmental hazards(World Health Organization). Furthermore, as a financial impact, it was stated that the drought of 1987 to 1989 managed to become the costliest drought in U.S. history, assessed at $39 billion, according to the NCDC.
Normally, natural disasters cannot be avoided or can be minimized through efficient planning and reporting systems.
The main motivation is that future lives that will be saved through prevention. Most of the solutions that minimize environmental incidents are relatively simple to execute, the big problem is missing available information to make assertive decisions.
SECTION 2: EXPLAINING THE SOLUTION
2.1. DESCRIPTION
Shaman platform works by crossing data that, through exploratory analysis aided by artificial intelligence, generates metrics and indicators for each type of environmental incident, where through its interpretation allows to find communities at risk of vulnerability. the data are provided by NASA through satellites and weather stations in conjunction with other relevant data generating sources, such as IBGE and INPE. The indicators used are the most diverse types, covering the most varied environments and which are resource specific to become relevant information.
Examples of indicators are HDI, terrain, rainfall, access to drinking water, and temperature. Criteria that can be used for example to define drought risk areas.
Identifying inclined areas to environmental impacts, as first appropriate measures, are the warning of the qualified authorities and organizations in order to handle the situation and give special attention to these locations.
Shaman on its way, aims to spread information, allowing users of various natures such as NGOs, governmental authorities, and other meaningful forces to help vulnerable communities, to have access to user-friendly already treated data, what provides an exponentiality of assertive solutions.
2.2. SCALABILITY
Among the impacts caused by Shaman, we can denote especially scalability, since the ideal model can already be reproduced on several extreme environments around the world. It is also an important feature coverage of the project, as it allows other categories not studied before to be data crossed and to obtain relevant information.
2.3. APPLIED MACHINE LEARNING
Our chosen methodology is to use regression line, or best-fitting line approach, and a convolutional neural network guided by extensively studies on the yield performance of crops under heat and drought stress to determine if a community is under a vulnerable situation. As stated [5], it was pointed out that the effect of temperature on corn yield using linear regression analysis showed a decreasing to almost half of crop yielding correlated to an increase by 6 ºC. Beyond the crop damage, that situation can lead to a worst case scenario, since severe heat stress can cause leaf firing, denoting a site under vulnerable features.
SECTION 3: FUTURE PLANS
Our next goals involves gathering local data that are not available through the already provided by NASA, and by other governmental open data, e.g, small farming likely vulnerable to the droughts from northeastern regions of Brazil.
Besides that, we pretend to optimize our research to minimize lurking variables that can hinder the accuracy of the correlation between the aimed problem and the region features.
REFERENCES
[1] Working with vulnerable communities to assess and reduce disaster risk. Retrieved October 20, 2019, from https://odihpn.org/magazine/working-with-vulnerable-communities-to-assess-and-reduce-disaster-risk/
[2] The Worst Droughts in U.S. History. Retrieved October 20, 2019, from https://www.livescience.com/21844-worst-droughts-in-u-s-history.html
[3] NASA. (2019). Datasets and images. Retrieved October 20, 2019, from https://data.giss.nasa.gov/.
[4] Linear Regression. Retrieved October 27, 2019, from http://www.stat.yale.edu/Courses/1997-98/101/linreg.htm
[5] Classification of Crop Tolerance to Heat and Drought: ADeep Convolutional Neural Networks Approach. Retrieved October 27, 2019, from https://arxiv.org/pdf/1906.00454.pdf