
Secure Natural Resilience| Rise to Resilience!
Project Details
The Challenge | Rise to Resilience!
Walking Rivers
Several places in the world face problems with rivers that change their courses, causing floods, interruptions on transport system, landslides and even border issues. Walking Rivers is a tool that shows when, where and what are the odds of this phenomenon
Walking Rivers
GENERAL STRUCTURE
This paper aims to present the background and methodological structure of the project developed by the SECURE NATURAL RESILIENCE - SNR team as part of the Rise For Resilience category of the NASA Space Apps Challenge 2019. The team is made up of two civil engineers with a master's degree in transportation, a civil engineer with a master's degree in geotechnics and a geographer, all working in the transportation infrastructure sector in Brazil. In addition, the team also comprises three high school students who work with the socialization of needy communities through sport.
Due to the group's professional experience, one of the members has already encountered a case of meandering river, which altered its course and disturbed the use of a bridge that had recently been inaugurated. A meander is a sharp curve of a river that changes its shape and position with variations in energy and river load during the various seasons of the year.
Predictive analysis of meander behaviors provides support to managers and planners for the delimitation of public policies based on strategies to mitigate the damage to urban and rural infrastructure caused by flooding, erosion and landslides due to the alteration of the river course. These include the interruption of basic services such as transportation, health, education and supply, the destruction of private property, alteration of territorial borders and, mainly, human losses.
The project aims to provide a web platform to predict the meander behavior, as a tool for verifying possible natural changes in the course of rivers in regions susceptible to this phenomenon.
VARIABLES AND CIENTIFIC SUPPORT
Jean-Louis Briaud e Axel Montalvo-Bartolomei (2014) showed that different aproaches can be made in order to understand the behavior of the meanders, covering empirical methods to calculate the rate of change of the meanders, models based exclusively on the geometry of the rivers, and hybrid methods that take into account several variables that affect the phenomenon.
Briaud e Montalvo-Bartolomei (2014) based their work in the following variables:
• Direction and speed of the flow;
• Soil erodibility;
• Aerospace / Photogrammetric Observations.
These variables bring information about the geometry of the water body gutter, collected through aerospace observation data and river velocity to describe its behavior. The predisposition for suspended material hauling processes is represented by an erodibility index defined by Briaud (2013)
Park (2007) brings in his work an analysis of the following variables:
• Meander angle;
• Ratio of radius of curvature to width, and;
• Froude Number and Critical Froude Number.
The variables considered in Park (2007) work as a subsidy for the calculation of the maximum and initial migration rates, which are employed in a hyperbolic regression model.
The methodological differences found in the works cited and in the bibliography present in them show both a lack of formal consensus on the application of methods and variables to determine the probability and behavior of meandering rivers. This scenario points to a problem of high complexity that can draw on the versatility of artificial intelligence models to be addressed.
PROBLEM APPROACH
The first step in predicting the evolution of meanders is to determine the current position of the river. With LANDSAT8 data it is possible to determine both the river course and its width in the studied region. This is done by an artificial intelligence model that evaluates each pixel in the delimited region and identifies, from 6 wave frequencies, whether the location corresponds to a region covered by water. From this it is possible to calculate the radii of curvature of the meanders. Allied to this, NASA - ATLAS / ICESAT 2 and MODIS bases give the slope and the height of the surface.
These data, paired with flow rate and velocity (MODIS), temperature, urbanization and vegetation cover (LANDSAT8), topography (SRTM), soil type and porosity (ISRIC - Wise & SMAPVEX08) and anthropic activity will be later entered into a second model of artificial intelligence that, from the mapping of real cases, will determine the coefficients of the prediction model.
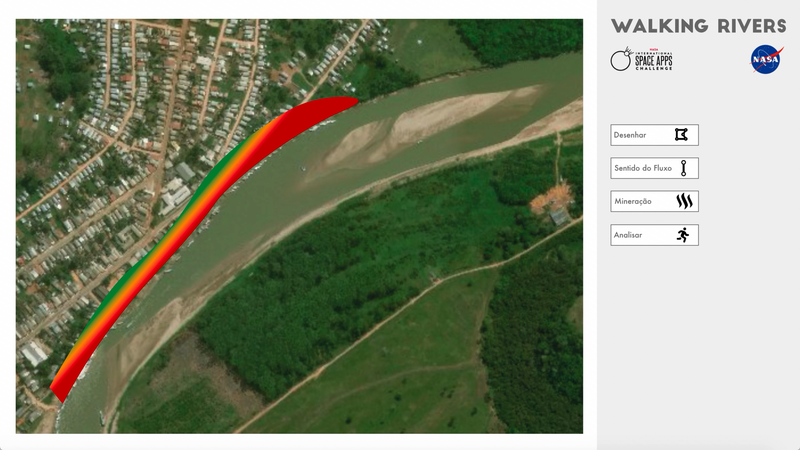
With this model it is possible to elaborate, for a given watercourse, a map that indicates the deviation in the meander and its probability of occurrence. This step is calculated from a Monte Carlo model. First we collect the maximum historical series of river flows. Then the probability distribution of the flow is determined. From there N simulations are performed for the desired design horizon where each simulation is a historical series generated from the probability distribution determined for the flow.
Thus, given a location chosen by the user (by defining a polygon, for example), the site searches the database if there is already a map susceptibility to that region. If so, it is returned to the user; otherwise, the procedures of watercourse identification, data collection and Monte Carlo simulations are performed, generating the desired map and updating the grid value in the database.
DATA AND COMPUTATIONAL INFRASTRUCTURE
This work was developed with python and can be seen in https://github.com/tiagobaroni/NASA_SAC). None of the products offered by the event collaborators were used.
FUTURE PLANS
The team intends to continue to develop this product. As it was developed for one specific region in Tarauacá, Acre, Brazil, two steps are needed to develop the Minimum Viable Product, MVP:
1. The definition of the train sample, enabling the generalization of the predictive model
2. The construction of the web platform
After the release of the MVP, several improvements will be done. Five of them are listed below:
1. Image edition tools, to allow the user to change colors and graphical aspects of the results
2. Shapefile import/export, so the user can upload the definition of the region under analysis and soil and geometry attributes.
3. Configuration tab with the possibility of manually changing the analysis parameters.
4. Generation of reports and calculation sheets.
5. Import a BIM model with the construction cost of the facilities in the city, making it possible to calculate the financial impact and the economical risk (risk = probability times impact) of the meander movements.