
coding style| Show the World the Data!
Project Details
The Challenge | Show the World the Data!
RGB earth
色彩化的地球
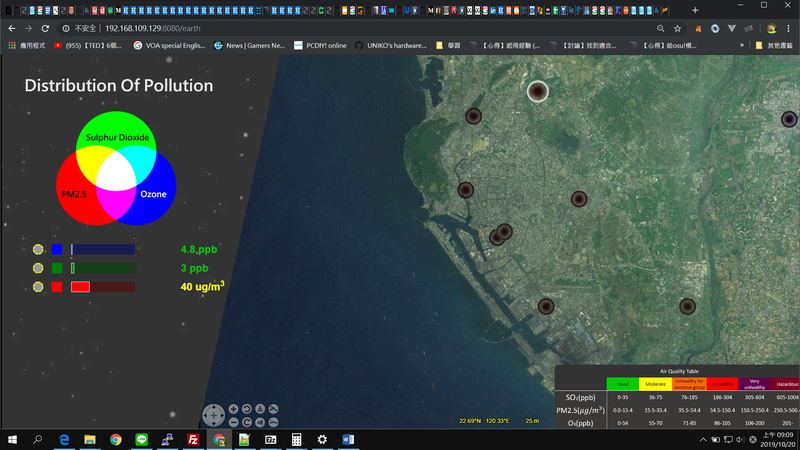
Web URL : http://23.100.92.219/earth
問題陳述
在資料的比對上,每次只能顯示一種資訊,我們想要用更多的資料去交叉比對,了解資料的共通點,應用在2D與3D的資料結構。
1.通過將空氣污染的三種指標(SO2 ,O3、PM2.5)去展示三種資料的交互作用。
2.以百分比跟實際數值去表現,讓民眾能夠更有概念去了解空氣汙染。
3.用時間軸去感受空氣之間的變化,將靜態的資訊變得更加視覺化。
Problem statement:
It can only show one information at the same time while data comparing. We want to compare more data and find common grounds that can be used in 2D and 3D data structures.
- Show how 3 different data act with each other by marking 3 index of air pollution (sulfur dioxide, ozone and PM2.5) on the map.
- Present data with real value and percentage, which lets people have more concept with air pollution.
- Feel changes of air with timeline and visualize the static data.
初步方法
1. NASA World Wind
2. 查詢各種空氣汙染的資料庫。
3. 將資料標記於地圖上(NASA World Wind)
Methods:
- Using NASA World Wind as the base.
- Inquiring data from databases of air pollution.
- Marking the data on the map (NASA World Wind).
團隊背景
Taiwan Tech student. 不分系大一
Archie :一般板金、汽車鈑金
Taroegg :資訊與網路技術
YU,CHUN-SHEN :網頁設計
CHU,YU-CHEN : 程式設計、翻譯
Background of members:
Freshmen of Taiwan Tech
Archie: auto body repair & sheet metal
Taroegg: information and network technology
YU,CHUN-SHEN: web page design
CHU, YU-CHEN: programing and translation
面臨問題
資料源不夠多,睡眠不足。
Facing problems:
- Lacking of data sources and sleep.
Resources:
- https://opendata.cwb.gov.tw
- Chunghwa telecom
設計語言
- JavaScript
- HTML5
使用函式庫
- NASA World Wind
- Node.js
- jQuery
Designing languages:
- JavaScript
- HTML5
Using libraries:
- NASA World Wind
- Node.js
- jQuery
未來步驟
可以選擇定義每個顏色的資料是哪一種。
Hope:
- Be able to define the color of each data by user.
Source:
GitLab: https://gitlab.com/codingstyle/showthedata
PowerPoint:https://drive.google.com/open?id=1YEj43Kh3S0_XPEa4...