
Smart Earth| Show the World the Data!
Project Details
The Challenge | Show the World the Data!
Smart Earth
There is lack of user-friendly environment for historical and new data from NASA earth observatories. Our app can show globe with different layers to indicate how different factors are distributed and how they are related to each other.
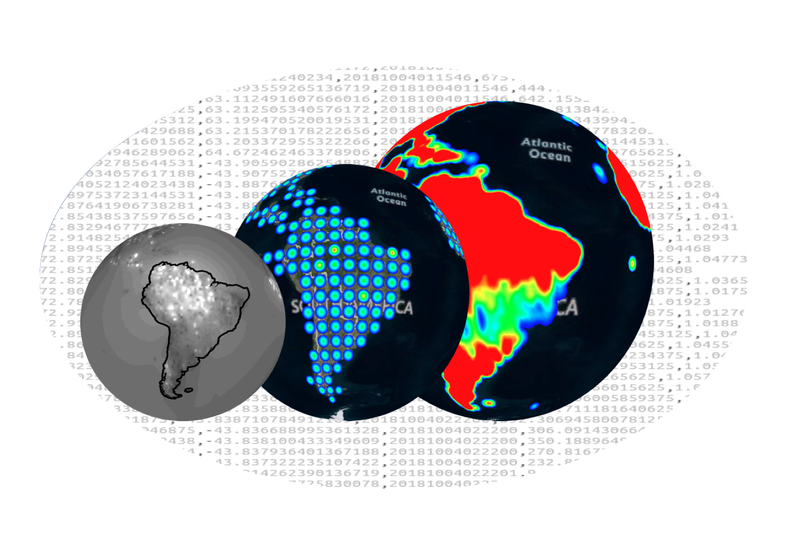
Problem: there is lack of user-friendly environment for historical and new data from NASA earth observatories i.e. the Orbiting Carbon Observatory, OCO-2. Moreover, it is hard to understand and interpret these measurements for not-scientist because you need to know what you are looking for. Therefore, our aim is: to create app which can show globe and different layers on top to indicate how different factors are distributed and how they are related (correlated/anti-correlated) to each other if more than one layer is added. This app used real OCO-2 data and NASA WorldWind tool.
#Background:
World climate data is too complex to understand and difficult to access. Our team offers opportunity to interactively explore NASA's climate change data in nearly real-time!
#What it does
Our application allows users to investigate NASA's CO2 emission data at any time by navigating 3D Earth model.
#NASA Resources
WebWorldWind App* leverages NASA's carbon dioxide measurements from OCO-2 orbiting carbon observatory** and monthly Atmosphere measurements from Nasa Earth Observations (NEO)***.
* https://worldwind.arc.nasa.gov/web/
** https://co2.jpl.nasa.gov/#mission=OCO-2
** https://neo.sci.gsfc.nasa.gov/
#Space Apps Offers
In order to reflect atmosphere measurements as reliably as possible, we used raw measurements from OCO-2 orbiting carbon observatory. Raw data represents point-wise CO2 ratios at specific locations, which had to be converted into smooth continuous Earth layer image. With valuable insights from Subject Matter Expert, raw data was pre-processed by interpolating missing pixel values.s
#Future Plans
WorldWind App could later support several layers representing different atmosphere measurements. Any user could feel like a true researcher by overlaying several data layers and look for patterns between different factors impacting climate change. App could also simulate possible impact of human activity reduction by combining statistical data and actual atmosphere measurements.
#Built With
JavaScript, GDAL libray.
#Try it out
Try out the App here!
Be patient it is slow!
http://beautiful-rabbit.surge.sh/
#Tags
#augmentedreality, #earth, #nasa, #javascript, #worldwind, #machinelearning