
The Elementals| Show the World the Data!
Project Details
The Challenge | Show the World the Data!
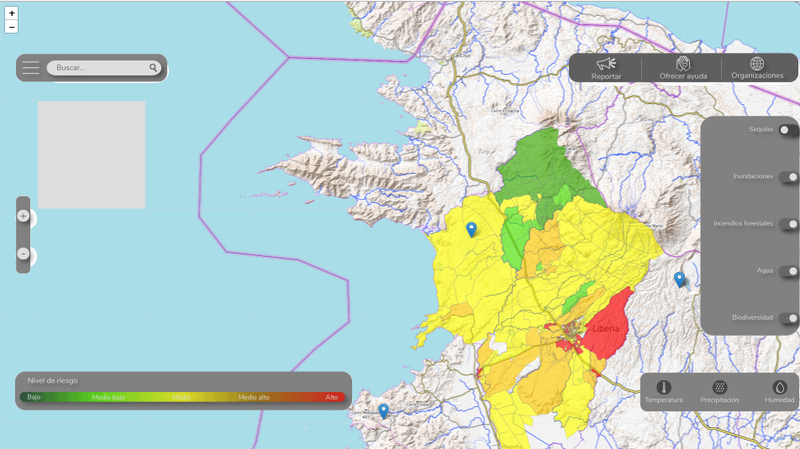
Vulnerability Atlas
A web page that gathers scientific data and reports made by people around the world about problems related to climate change, to inform organizations and governing bodies that are minded to take the initiative over the necessities presented.
It is clear that there is no direct communication between communities vulnerable to climate change and the organizations and governing bodies. There are censuses and demographic studies that represent a large population, but minorities may not be represented. Currently, the way of communication between these two sectors is usually a tedious process and full of intermediaries.
Our challenge is to build an intercom bridge between people in need and entities and organizations that have the tools and resources to address and solve this problem. Through the development of Vulnerability Atlas, the union of scientific information and reports from communities relevant to climate change that want to be heard will be achieved, and thus be able to make decisions that impact.
Resources: