
Project Details
Awards & Nominations
CAFE has received the following awards and nominations. Way to go!
The Challenge | Surface-to-Air (Quality) Mission
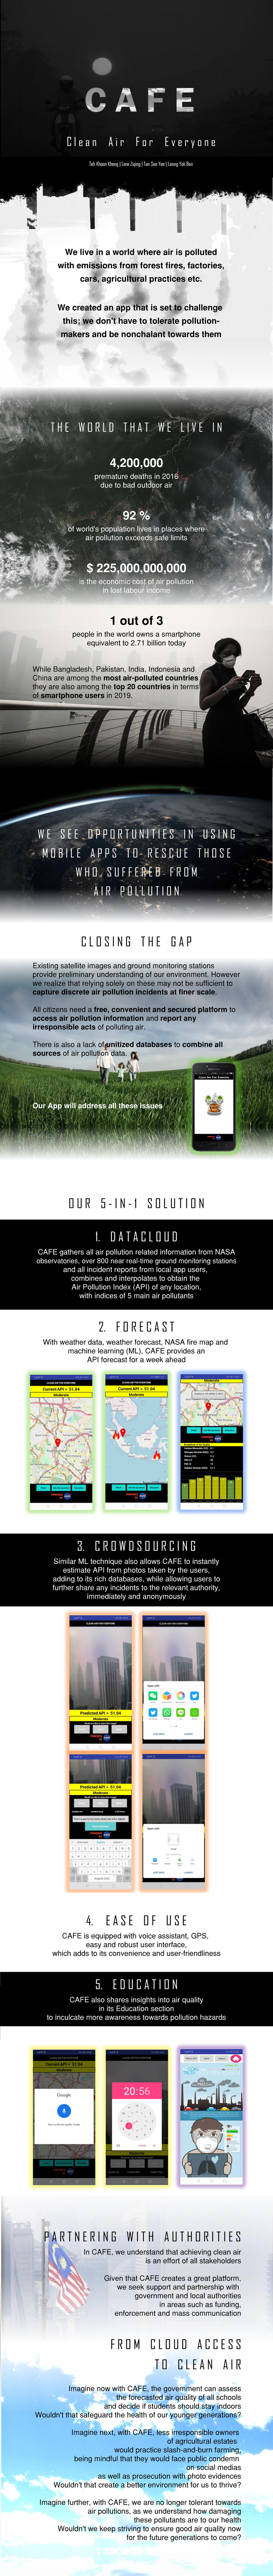
CAFE - Clean Air For Everyone
From cloud access to clean air, CAFE is the platform that combines satellite data, ground stations data with crowd-sourcing information to provide air quality forecast, assist law enforcement and raise awareness. #airquality #crowdsource #API #pollution
current and future development
While CAFE was born under 24 hours, our idea has received tremendous response from the locals. Subsequently, we are working on further developing the CAFE app in preparation for roll-out. The two directions of development are:
Enhancing Air Quality Analysis and Prediction
The app is currently using a simple diffusion model to estimate air pollution concentrations in air. While this model is proven to give accurate results under normal weather condition, it is prone to weather conditions such as rain and crosswind at higher atmosphere. To better understand how weather affects the air pollutants concentration, we turn to machine learning to give us better prediction. We are collecting comprehensive weather data, fire data and air pollutants concentration at fixed points; further plan includes engaging meteorologists and academia to contribute to the prediction models.
Engaging Local Authorities
We are in the midst of discussions with a few local authorities in Malaysia who are keen to bring this technology further. With the support of local authorities, we target to conduct a pilot run in a city in Malaysia, before rolling it out globally.
project codes and resources
The codes are written in Python 3.7. External packages involved are stated clearly in the codes.
Description is also attached in every code snippets to provide better insights of what the codes do and the techniques involved.
Sources
Air Pollution Data in CAFE
Nitrogen Dioxide Concentration, NASA Earth Observations:
https://neo.sci.gsfc.nasa.gov/view.php?datasetId=AURA_NO2_D&date=2019-09-01
Carbon Monoxide Concentration, NASA Earthdata:
https://discnrt1.gesdisc.eosdis.nasa.gov/data/Aqua_NRT/AIRS2RET_NRT.006/
Sulfur Dioxide Concentration, NASA Earthdata:
https://discnrt1.gesdisc.eosdis.nasa.gov/data/Aura_MLS_NRT/ML2SO2_NRT.004/
Real-time Air Quality Index of 800 over ground-stations, The World Air Quality Project:
Fire Data in CAFE
Active Fire Data from Visible Infrared Imaging Radiometer Suite (VIIRS), NASA Earthdata:
https://earthdata.nasa.gov/earth-observation-data/near-real-time/firms/active-fire-data
Weather Data in CAFE
Weather data and forecast using Weather API, OpenWeather:https://openweathermap.org/api
Weather Prediction in CAFE
Simple diffusion model and its effectiveness, paper on 'A Simple Diffusion Model for Calculating Point Concentrations from Multiple Sources' by John F. Clarke:
https://www.tandfonline.com/doi/pdf/10.1080/00022470.1964.10468294
Photos In CAFE Project Page
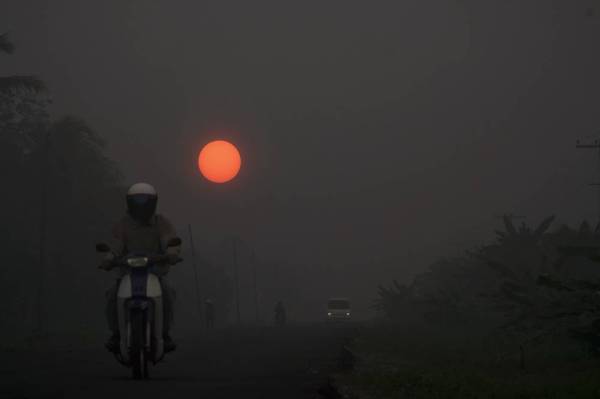
Sinar Harian Hazy Photo:
https://www.sinarharian.com.my/uploads/images/2019/09/22/467626.jpg
Factory Emitting Smokes:
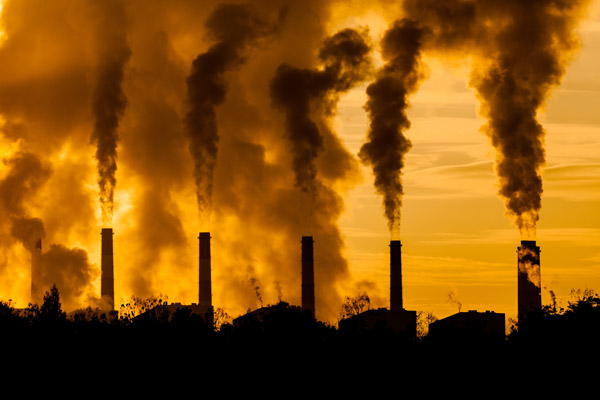
Nasa Image of Amazon Fire:
https://www.nasa.gov/image-feature/goddard/wildfires-in-amazonian-region-of-brazil
Bloomberg:
Nasa Image of Earth:
https://www.nasa.gov/feature/top-15-earth-images-of-2015
Happy Family on grass field:
https://ak9.picdn.net/shutterstock/videos/3897269/thumb/4.jpg
Bernama, working with authority:
http://www.bernama.com/en/news.php?id=1755756
Statistics In CAFE Project Page
WHO air pollution premature death:
https://www.who.int/en/news-room/fact-sheets/detail/ambient-(outdoor)-air-quality-and-health
World Economic Forum on percentage of people living in poor air quality:
https://www.weforum.org/agenda/2016/10/air-pollution-the-true-cost-in-numbers/
Economic Cost of air pollution:
Smartphone users:
https://techjury.net/stats-about/smartphone-usage/
Air pollution by countries:
https://www.airvisual.com/world-most-polluted-countries
Smart phone users by countries:
https://newzoo.com/insights/rankings/top-countries-by-smartphone-penetration-and-users/