
itriNASA| Surface-to-Air (Quality) Mission
Project Details
The Challenge | Surface-to-Air (Quality) Mission
Integration of Satellite and Ground Data for Air Quality
Our project is aimed to display air quality with the integration or filtered data from both satellite and ground monitor data.
1. Project background:
i. Goal:
The resources and data base of regional weather and pollutant information are various. The public may be confused and just wants to know when and where we should put on our masks to prevent from bad air quality. Thus we would like to produce the algorithm and pipeline to filter or integrate information from multiple data resource.
ii. Members:
Our team members are all software developers. We want to dedicate our profession to help people raise the awareness of local pollution.
2. Data:
i. Selection criteria:
First of all, we list several selection criteria for the similar data sets from satellite and ground monitoring resources. Here are the rules:
•Smaller deviation
•Spatial resolution
•Preprocessed data
•Source origin (government, research institute etc.)
•Parameter integration
•Higher correlation between satellite and ground monitoring data sets (ex: CO & black carbon mass concentration)
ii. Data process
The data may have too many parameters and attributes exceeding the information we want. Therefore we initially built up the date pipeline to extract the specific parameters, such as latitude, longitude, time, PM2.5 and concentration of carbon monoxide, Ozone etc.
Below is an example of our data structure:
nyNode(id='time_tree')
├── AnyNode(date='2018-01-01')
│ ├── AnyNode(time='00:00:00')
│ │ ├── AnyNode(place='Anaheim', pm25=22.0, position=(33.830585, -117.93851))
│ │ ├── AnyNode(place='LaHabra', pm25=0.9, position=(33.92506, -117.95258))
│ │ ├── AnyNode(place='LosAngeles', pm25=None, position=(34.0664, -118.227))
│ │ ├── AnyNode(place='Reseda', pm25=5.0, position=(34.1992, -118.533))
│ │ ├── AnyNode(place='SantaClarita', pm25=5.0, position=(34.3833, -118.528))
│ │ └── AnyNode(place='SouthLongBeach', pm25=5.0, position=(33.7922, -118.175))
│ ├── AnyNode(time='00:30:00')
│ │ ├── AnyNode(place='Anaheim', pm25=1.61, position=(33.830585, -117.93851))
│ │ ├── AnyNode(place='Glendora', pm25=2.6, position=(34.1439, -117.8508))
│ │ ├── AnyNode(place='LaHabra', pm25=2.6, position=(33.92506, -117.95258))
│ │ ├── AnyNode(place='LosAngeles', pm25=2.6, position=(34.0664, -118.227))
│ │ ├── AnyNode(place='Reseda', pm25=2.6, position=(34.1992, -118.533))
│ │ ├── AnyNode(place='SantaClarita', pm25=2.6, position=(34.3833, -118.528))
│ │ └── AnyNode(place='SouthLongBeach', pm25=2.6, position=(33.7922, -118.175))
iii. Example data
For the behalf of our test module, we mainly use the data samples provided by the Space Apps Challenge. The main area is in Los Angeles, USA and the time period is in the year of 2018.
3. Data comparison and algorithm
i. Temporal resolution
Various data have different temporal resolution and may have missing or bad data points. According to that, we have to integrate the minimum or common time step to display the available data.
ii. Correlation
Within the different data sets between those from satellite and ground monitoring, we also analyze the correlation of several parameters. If the correlation of one similar parameter from both resources is relatively high, the parameter can be included into our data structure and shown on the program.
iii. Data loss
If the ground data has missing temporal points, we will either integrate the time step to a larger one or compensate the displayed data from satellite sets.
iv. Spatial resolution
If one of the satellite data sets has better spatial resolution, we would choose to include that from the uploaded ones.
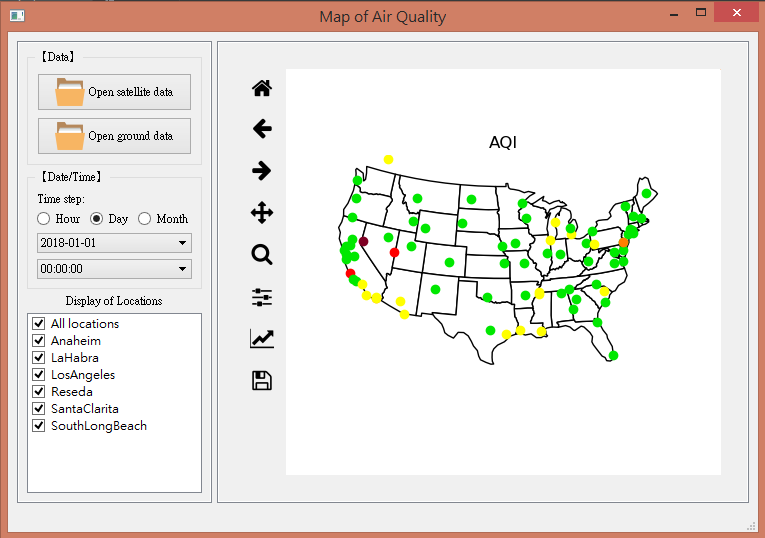
4. Program prototype
The GUI of our prototype program is as our project image.
The left part can load the data sets from satellite and ground monitor respectively. The full functions have not been finished yet.
The ideal algorithm would automatically compare and filter the data information. After procession the integrated data points are able to be displayed within the map and the list of location and time can be shown on the left side. Users can choose the locations and time they want to show on the platform. The data points will simply show the standard AQI (Air Quality Index) and are easy to understand.
5. Prospective work
The algorithm of data extraction should be implemented with more knowledge about meteorology. The program also needs to be enlarged with global map and show numerical detail on the map.
Link:
github:
https://github.com/hsnucloud/NASA2019SpaceApps
ppt:
https://drive.google.com/open?id=1Y4KLVNMiJ4fILvTIPmV0edw7JvGkbSr5