
Project Details
The Challenge | Surface-to-Air (Quality) Mission
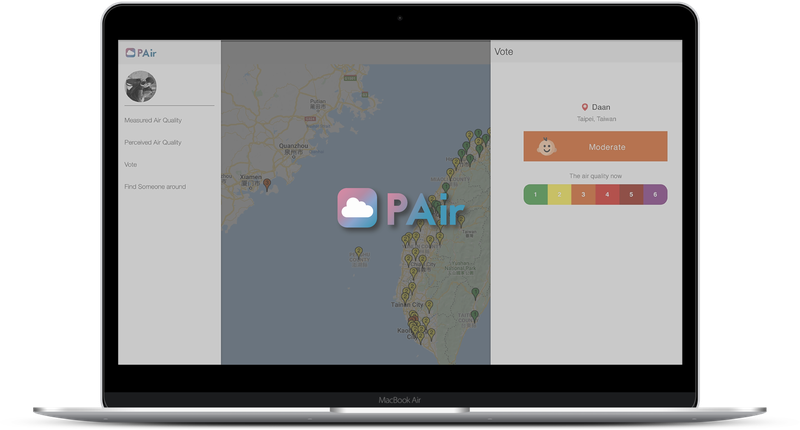
PAir
Air quality information platform. We integrate our App with an online dating platform as an incentive to encourage citizen participation.
MOTIVATION
AQI(Air Quality Index) is a measure of air pollution. Currently, each country has their own way of calculating AQI. We observed an important usage of the AQI data is to serve as an indication of the air quality to the general public. Hence, aside from building a platform where satellite and ground-based data are aggregated and kept, we also desire to emphasize on the density of the data available rather than the exact precision of the index.
WHAT WE BUILT?
Our team built an Air quality information platform (App) by integrating satellite data, ground-based datasets and citizen measurements. We integrate our App with an online dating platform as an incentive to encourage citizen participation.
OUR SOLUTION
- Since each satellite provides different kinds of data, we provide an API to enable uploads of {key, value} pairs as data fields to store in our database.
- For each satellite, we maintain a deep learning model given their data fields. Outputs of the models are levels between 1level of air quality at the specific location. The weights of their models are updated every time the satellites predict at locations where there are ground-based stations or areas with sufficient citizen measurements.
- Perceived data are data provided by citizen measurements. Citizens are allowed to upload their measurements of the 6-level AQI at their locations to augment ground-based data. Measurements are levels between 1 to 6 (from good to bad air quality), and a prediction of the real AQI in the region is a weighted average of the measurements in nearby locations.
- Citizen measurements are stored and compared to grade a person’s accuracy of measuring the air quality. A person is likely to upload inaccurate data without supervision and incentives. We hence propose a statistical model that calculates the grade of a person’s accuracy based on the variance and bias of his historical measurements.
- People with higher accuracy will have a higher exposure on the dating platform, which serves as an incentive to encourage more accurate measurements.
DEEP DOWN SOLUTION
- Custom Deep Learning Modelsfor Satellites: For each satellite, we train a customized deep learning model to learn the relationship between satellite data and real ground-based AQI values given their fields of features.
- Weighted Maximum Likelihood Estimation: For each location, we calculate the perceived AQI based on weighted maximum likelihood algorithm. For a given set of citizen votes, we first consider the probability distribution of real AQI level given the votes, i.e. 6 distributions, Prob(real AQI level | vote AQI level=1) ~ Prob(real AQI level | vote AQI level=6) for every user. When given a location without real data, we weighted-sum up the distribution corresponding to the person’s voting history and his/her current vote as a final score. The “weight” is negative correlated with the variance.
SOFTWARE TOOLS
Python, JavaScript, Azure
SLIDES
https://drive.google.com/open?id=1TbBjHVH-M3yIiCnMP3EVnpMD1deGbLXx
CODE
https://github.com/reggiehsu111/nasa
RESOURCE
[2] NASA Jet Propulsion Laboratory - Microwave Limb Sounder (https://mls.jpl.nasa.gov/?fbclid=IwAR2TemNxnpbf6VEFkGEqJ5-iZHYlcYwIKaNraqWvlA6g-64IgB7bO_kwDZc)