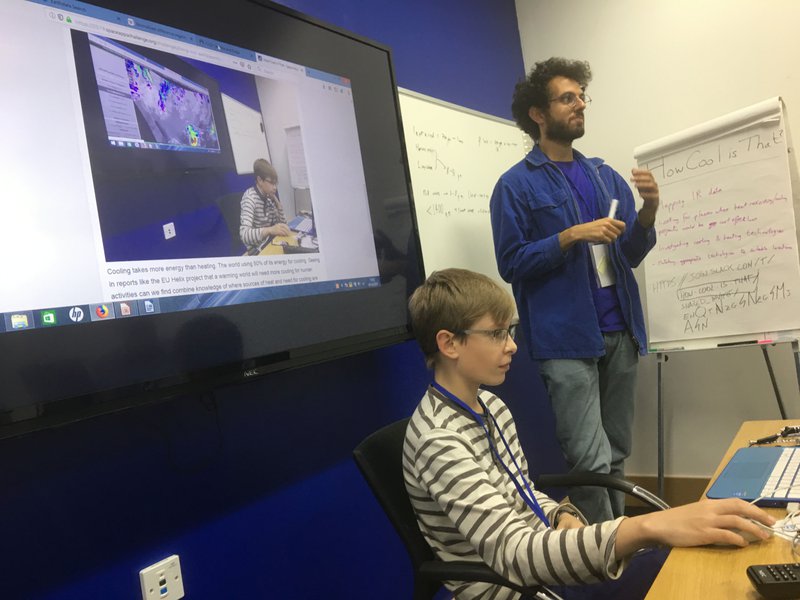
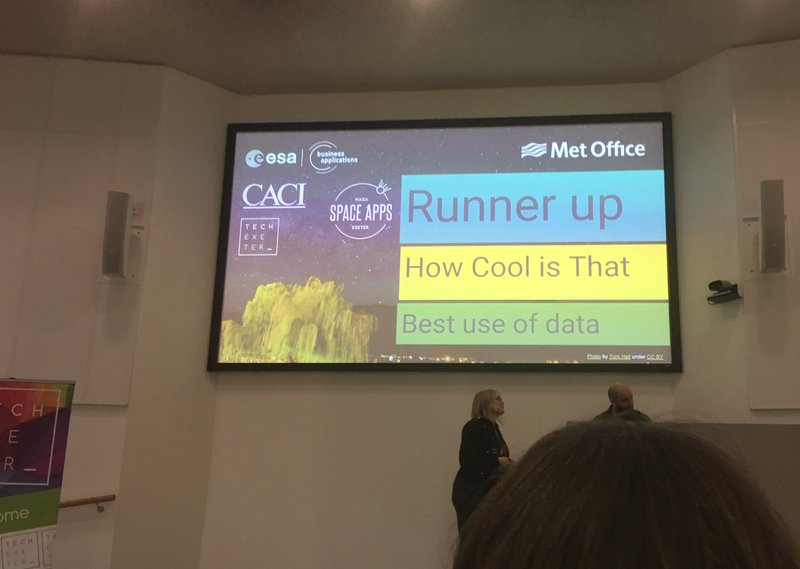
How Cool is That| Warming Planet, Cool Ideas
Team Updates
Updated the video from the silly one about us joking about not wearign glasses to the more informative:
Trying to find a better way to just get the data we want.
Looking at https://landsat.usgs.gov/spectral-characteristics-...
TIRS is definately the ones we want, now to see if we can get them into the app.
https://docs.google.com/presentation/d/1aVcIGhAMi2... Our presentation
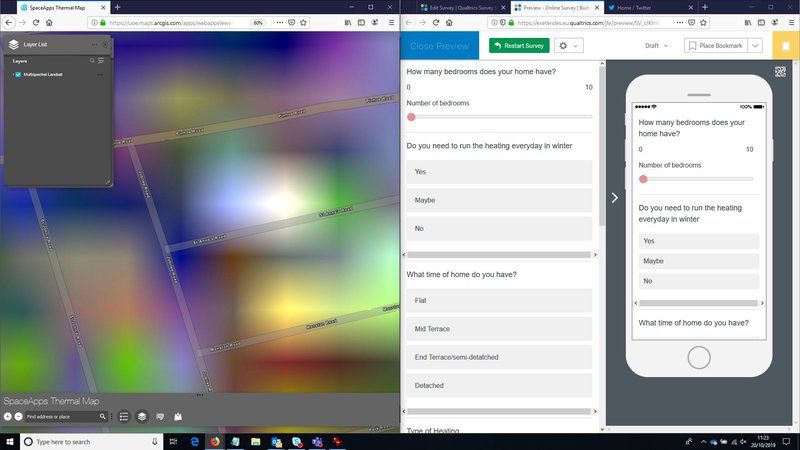
We created a proto survey - https://exetercles.eu.qualtrics.com/jfe/form/SV_cIKmkbHRq95rXzn
The idea being that users would take the survey and that would generate a score that would then be combined with a score from the survey data to allow us to give suggestions on things to do. This could be in the form of insulation, or modifications to buildings. It would be our hope that organisations who have waste heat could transfer it to locations that need it, or passive methods of cooling could be employed.
Starting to come together. First tentative steps to the web-page. Still have some cgi data collection work to do on the first page but it is a start.
<http://www.hidecs.co.uk/NASA-SpaceApps-Challenge/I...>
More to follow.
Sources of IR data
Extremes of temperature.
Median
Infrared extends from the red edge of the visible spectrum at 700 nanometers (frequency 430 THz), to 1 millimeter (300 GHz).
Humans actually emit (instead of just reflecting) at IR wavelengths. Our normal body temperature radiates chiefly within the thermal infrared region of (8 – 15 µm) or (0.008 – 0.015 millimeters) – a frequency range of 20–37 THz.
https://landsat.gsfc.nasa.gov/thermal-infrared-sen...
https://search.earthdata.nasa.gov/search?m=-0.0703...
https://helixclimate.eu/publications/
https://www.mtpv.com/products/
https://twitter.com/richardbranson/status/11855537...
https://earthdata.nasa.gov/earth-observation-data/...
https://uoe.maps.arcgis.com/apps/webappviewer/inde...
Not actually sure what the colours in the 3 lansat layers actaully means
In addition to the amount of Greenhouse gasses that we emit from human activity into our atmosphere form a blanket that retains our other major emission. Thermal Energy. The world expends 50% of its energy production just to provide cooling for many of our industrial activities[1]. Two of the largest users are the informatics and the food 'cold chain'
The team feel that more passive means are required for such cooling, where energy production is minimal or not required. Architects and Town Planners deciding that most streets will feature sizeable trees will keep the street cooler by providing the shading to those using the street and to the buildings alongside.
The use of slatted shading on the sides of glass fronted buildings to keep insolation of the inside of the building at reasonable levels. Position and provision of ventilation breeze-ways to reduce the need for air conditioning.
In large industrial processes, we should also look to remove the waste heat from processes and move it to where it will do some good. Like baking biscuits or making pottery with the waste heat from a steel mill. Even considering the use of Thermal Storage Units that can be shipped to where there is a heating need.
[1] A Tank of Cold: Cleantech Lapfrog to a more food secure world. A report by the IMechE.
<https://www.imeche.org/policy-and-press/reports/de...>
....Absorbtion of infrared by water...
So looking at NASA data we have hit a snag. We want to look at thermal loss from buildings and this is likely to be in the long wave infrared. That conflicts with the absorbtion of water. It is also not quite what the satelite collect. So can we infer the data we want? This about NDVI data which is an indication of foliage which is made up from the Red light and the near infrared (https://en.wikipedia.org/wiki/Normalized_differenc...) Can we infer something from the data available to us?