
Proyecto Orion | Warming Planet, Cool Ideas
Project Details
The Challenge | Warming Planet, Cool Ideas
Climópolis
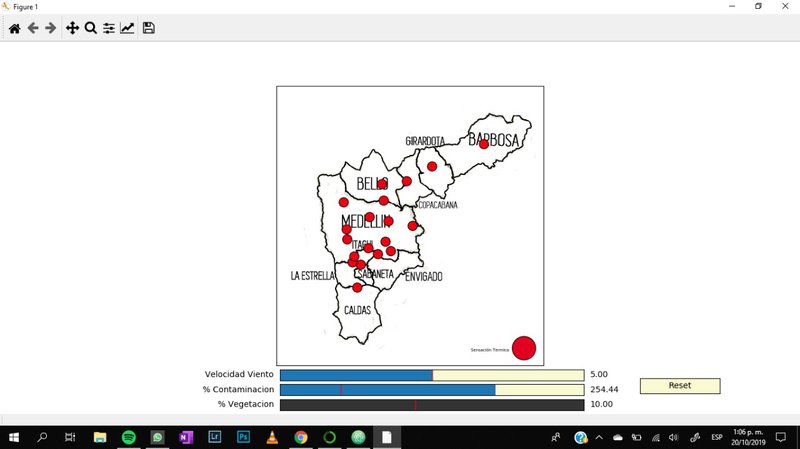
Climópolis is an interactive and educative app where users can play with parameters such as green areas, contamination, and others and know how the increase or decline affect the temperature of the city, understanding as well the causes and consequences.
BACKGROUND
The urban heat island effect describes the phenomenon whereby cities are generally warmer than surrounding rural areas. UHI increases energy consumption, air and water pollution, and, in general, reduces the urban life quality. Consequently, mitigation and adaptation is a priority in many cities around the world. Although this effect can be perceived in the Aburra Valley, where the city of Medellin is located, it has been studied superficially and so far there are no prevention or mitigation measures at the regional scale, and by consequence, the citizens don't have enough resources for understanding how activities affect the temperature of the city and it's effects in health and life quality as it is suggested; and this is linking with the concept of noosphere. Noosphere is the sphere of thought and consciousness that the world has. As detailed by NASA, has a prospective development that goes hand in hand with the climate and therefore with the problem of global warming.
WHAT IT DOES
Our idea directly affects this noosphere: We try to give our users the basic knowledge of what it could mean for the climate of one city changes in things like pollution, deforestation and amount of urbanism. Take the problem directly to your home, to your city. Our app tries to give a message: Climate change is not a distant problem to anyone, quite the contrary, we are all involved in this problem that is right in front of you.
App works as follows: It allows you to choose a city, for the moment only Medellín, and once on the city screen yo can alter the amount of vegetation, of urbanization, the percentage of increase in pollution and the speed of wind that reaches the city. The interactive variation of these parameters will give you a temperature value that will serve as a pedagogical purpose to communicate to the user a consequence of the parameter changes. Additionaly, a message window will notify you that possible causes could lead to these parameters behaving in this way, as well as the possible consequences of them and the temperature taking those values.
Problems? Many, try to choose an idea amon many that may arise with such a broad problem. Try to have 6 virtually unknown people forge a project together for 48 hours. There was our greatest difficulty, we did not understand well what we had to try to get the app and we ended with 3 different solutions to the challenge using the app. But right there we were our greatest achievement, getting the agreements and walking altogether to achieve the same goal was fundamental.
BUILD WITH
Software used was Python and AppInventor, both free to use. Hardware used was PC and cell phones.
TRY IT OUT
Our code is in: https://github.com/CamiloRuizAlv/Mis-programas/blo...
Try by yourself
RESOURCES
Nasa Resources
We mainly use data, references and information provided by NASA for two items: Global pollution and temperature level.
We managed to find the relationship between the concentration of greenhouse gases and their effect on temperature in studies done by the IPCC, an institute that NASA uses as a reference on the challenge page. The link to the page where we get this relationship is as follows: ipcc.ch/data/ ipcc.ch/report/ar5/wg1/
In the case of temperature levels, we used the interactive resources and heat maps obtained from hurricane studies and others to determine the average temperature of the area in wich the app was going to develop the pilot presented here. The links used primarily for this were: svs.gsfc.nasa.gov/4626 www.gfdl.noaa.gov/global-warming-and-hurricanes/
Finally, other information like temperature health effects were obtained in the NASA references like this: climate.nasa.gov/vital-signs/global-temperature/
Other Resources
The data were taken from the following papers and contamination data from NASA, as well as IPCC.
Bedoya, J., & Martínez, E. (2009). Calidad del aire en el Valle de Aburrá Antioquia-Colombia. DYNA (Colombia), 76(158), 7–15.
OMS. (2005). Actualización mundial 2005, 1–21.
Vargas, A. M. S., & Pinto, Y. T. R. (2015). Modelo de simulación para el proceso de calentamiento global. APlicación ciudad de Cartagena de Indias, Colombia. Universidad Católica de Colombia. https://doi.org/10.1145/3132847.3132886
Soto-Estrada, E. (2019). Estimación De La Isla De Calor Urbana En Medellín, Colombia. Revista Internacional de Contaminación Ambiental, 35(2), 421–434. https://doi.org/10.20937/rica.2019.35.02.13
Martinez, A. (2017). Islas de calor en el área urbana del Valle de Aburrá, 163. Retrieved from http://www.bdigital.unal.edu.co/57837/1/1039453046...
Poveda Jaramillo, G. (2006). El Clima de Antioquia, (May), 117–128.
TAGS
#python, #app, #education, #climatechange, #cities, #noosphere