
Feeling the data| Chasers of the Lost Data
Project Details
Awards & Nominations
Feeling the data has received the following awards and nominations. Way to go!
The Challenge | Chasers of the Lost Data
Feeling the data
Unleashing the power of the brain through Crowd Sourcing. If you can feel it, you can fill it.
------------------------------------------------------------------------------------------------------------------------
------------------------------------------------------------------------------------------------------------------------
The problem
Although we live in the age of big data, where machine learning algorithms can achieve impressive results, not all data sets are complete. Even though several techniques and algorithms aimed at data sets with missing samples do exist, they do not always perform well, especially when dealing with sparse datasets.
So how can we fill in the gaps in these, often sparse, datasets?
Does estimating the missing values improve our models in terms of accuracy?
1. Our best data processing tool: the brain.
The human brain is an incredibly complex and powerful tool for processing visual stimulus. It can process huge amounts of visual information quickly, identifying patterns and structures while creating abstract representations. For example, if we erase several pixels of an image, a kid can easily fill in what is missing in his mind, even if the image is severely corrupted. However, this is not the case for other types of data and representations which are less intuitive to us. Choosing the right color of a pixel in an image is much easier than choosing the right number or tag in a NASA database.
If you can FEEL it, you can FILL it!
Creating intuitive visual representations from a dataset is an extremely complex problem. It is necessary to apply transformations to the fields in the data frame, which can be in various different formats: integers, tags, text.
The aim of these transformations is to convert these values into variables we can represent graphically, for instance in a colored scatter plot. Hence the dimensionality of data must be reduced. Moreover, we want these graphical representations to be the most intuitive so that people can guess the missing values better. In order for the final visualization to be effective, it is essential that these transformations carry information about the correlation between the different variables in the original data set. Otherwise, filled in values would be extremely inaccurate.
Furthermore, we need to evaluate people’s ability to fill in data. To do so, some of the missing points will be artificial. We will deliberately erase some of the points in order to evaluate the accuracy of user filled in values. We then intend to use reinforcement learning techniques to find the best visual representation.
2. Our solution
1. The missing values in NASA data frames are estimated using a Low Rank Matrix Completion or Matrix Completion by Partition Alternating Minimization algorithm. These will serve as a default values.
2. Various visual representations are generated by using T-distributed stochastic neighbour embedding.
3. The visual representations are gamified. These visual representations have artificial missing values.
4. Crowd Sourcing: Through advertising campaigns and games people are encouraged to fill in the missing values (both real and artificial).
5. A reinforcement learning algorithm is used to determine which is the best visual representation for each given datasets. The cost will be calculated by using the a performance metric over the artificially missing values.
6. Another reinforcement learning algorithm is responsible of choosing between approximating the data set by averaging user filled values - the wisdom of the crowds, or by any of the algorithms proposed in (1).

3. Gamification and Encouragement
Effectively encouraging people to fill in the missing values is essential. Without huge amounts of inputs, our Crowd Sourcing technique fails to give an accurate estimate. The idea is that inaccurate estimations should cancel out, and the average should be close to the correct answer.
Let us illustrate this hypothesis with an example taken from James Surowiecki in The Wisdom of Crowds: Why the Many Are Smarter Than the Few. “The opening anecdote relates Francis Galton's surprise that the crowd at a county fair accurately guessed the weight of an ox when their individual guesses were averaged (the average was closer to the ox's true butchered weight than the estimates of most crowd members).”
It is evident that there may be disagreement among annotators, but probabilistic approaches for dealing with multiple annotators providing noisy labels have been extensively studied for data labeling ( Learning From Crowds from Raykar et al. (2010), or Active Learning from Crowds (2011) Yan et. al).
Our solution encourages people to participate in two ways:
- Gamification. The games are: "Paint the Star" and "Place the supernovae." As the hero, calledMichael Collins, explores the galaxy, he encounters several challenges in which he must indicate what he thinks the color of a certain star is and where it should be placed. Michael is rewarded with scientific curious fact and game-points for accurately filling data, unlocking new levels. Scores are based on artificially erased values (for which a ground truth exists). Furthermore, there will be international competitions where prizes can be given to top players by NASA, such as a five night-stay in an exclusive resort in Neptune.
- Contributing to science. Studying astrophysics is not the only way to contribute to space exploration. Our solution introduces a novel way of contributing in which everyone, no matter their background or technical knowledge, can make a difference. Through campaigns, people will realize that by playing, they can make a difference in the accuracy of ML models used in space exploration. Thus, they will contribute their grain of sand to science and the future of human kind.
Our solution transforms this:

Into this:

And that, into this:

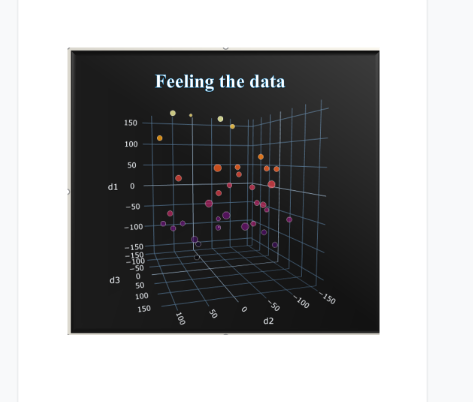
Here are some examples of representations applied to the "Near-Earth_Comets_-_Orbital_Elements" and the "Meteorite_Landings" data seta. We first used T-distributed stochastic neighbor embedding to lower the dimension of the first eleven columns, obtaining a 3 dimensional set. Then we plotted this data points in a 3-D scatter plot using the python library "plotly".
In the plot above, the two black points are the missing values. (This missing values are empty entries in the 12th column ( A1 (AU/d^2) in the Near Earth comets database).) Their position (x, y, z coordinates) represent the information in the first eleven columns of the data set. The color is the 12th column: where the missing values are. Afterwards, everybody can use the processing power of their brain to decipher the structures and patterns behind the coloring of the plot and "paint the galaxy". The average color painted is then mapped back to the original numerical format in the data set.
Thanks to the artificial missing values we can decide which visualization is better (more intuitive) and choose between different representations or even the default values obtained by Matrix Completion Algorithms.
Possible visual representations of the Near earth comets database after stochastic neighbor embedding:
In these visual representations, the 12th column -where the missing values are- is represented by the color of the points in the scatter plot. The black points in these plots are the rows in which the entry of the 12 column is empty (NaN in the pandas data frame.)

Possible visual representations of Meteorite Landings database after stochastic neighbor embedding:


(The code "representations.py" is available in the GitHub Repository and in the jupyter notebook uploaded in the repository). We encourage everyone reading this to download and run the notebook. If ran with no changes the missing points will be colored red. It is highly recommended to explore other visualizations by changing the dimensions of the transformation and the plotting settings.
4. Other Perks
An important advantage of our solution is that sensitive data sets with confidential information can also be filled. The users will not access the raw data, just a visual representation of it, in other dimensions and with zero knowledge of the exact transformation we applied in other to achieve that visual representation. In consequence, decoding this representation is an almost impossible task, making our solution safe for the types of information NASA handles.
5. A Glimpse into theory.
5.1 Matrix Completion by Partition Alternating Minimization.
Several algorithms in scientific literature tackle the problem of filling missing data, and it is an active area of research. In particular, we propose using a method called Matrix Completion by Partition Alternating Minimization.

In this algorithm N D-dimensional data points are arranged as a matrix X. W is a mask that indicates which entries of the original matrix are missing, with the same dimensions than X. One of the key differences between this algorithm and Matrix Completion by Power Factorization is that we use a subset of the samples in each iteration. Another big difference is initialization. In this algorithm we use the orthonormal matrix Q, obtained from the QR decomposition of X.
It has been proved that, under certain conditions, this algorithm converges to the optimal global solution (Theorem 3.5 - Generalized Principal Component Analysis).
Another good algorithm (the one we have implemented using Python) is Low Rank Matrix Completion by Proximal Gradient.
This algorithm tries to find a matrix that resembles the data in the observed entries while being of low rank at the same time. This is achieved by minimization of the nuclear norm of the estimated matrix, alongside an augmentation of the penalty term via Frobenious norm.
Code is available on https://github.com/franchesoni/nasa_space_apps_lrmc/tree/master
Both algorithms have been extracted from 'Generalized Principal Component Analysis' - Vidal
5.2 A useful visualization algorithm
Data has a probabilistic nature (i.e: can be thought as the result of a random experiment that obeys a certain probability distribution.)
We aim to reduce the dimensionality of the data by using T-Distributed Stochastic Neighbour Embedding.
This algorithm is based on the following hypothesis: points that are close to each other in the high dimension space will also be close to each other in the low dimension space. In order to do that, the KL-divergence between the probability distributions is minimized. This densities are obtained by combining the probability densities (Gaussians) of finding a neighbour next to each point of the data set.
Another useful algorithm is Multidimensional Scaling. Furthermore, Principal Component Analysis decomposition can also be used in the representation.
5.3 About categorical data.
In general, databases have categorical values. In order to apply the algorithms described above, we need to transform these categorical values into continuous or numerical variables.
In order to do this, we can use one-hot encoding. Categorical data is not a problem in visualization, as there are simple ways of representing this type of data (as the shape of the point, etc)
5.4 Reinforcement learning algorithms.
The Reinforcement Learning (RL) algorithms suitable for the task of selecting a visualization, on one hand, and selecting the completion method, on the other hand, can be chosen from those used in the popular multi-armed bandit problem. Two interesting ones are Upper Confidence Bound and Gradient Bandit. Further details can be found at Reinforcement Learning - an introduction.
6. About us


7. Resources
Presentation: https://docs.google.com/presentation/d/1Q1KqthlZo2...
GitHub Repository: https://github.com/franchesoni/nasa_space_apps_lrmc/tree/master
- Learning from crowds:
http://www.cs.columbia.edu/~prokofieva/CandidacyPa...
https://pdfs.semanticscholar.org/86d2/add9aa90014a...
- Books and other ressources:
https://www.springer.com/gp/book/9780387878102
http://incompleteideas.net/book/RLbook2018.pdf
https://en.wikipedia.org/wiki/T-distributed_stochastic_neighbor_embedding