
AquaAlta| Rising Water
Project Details
The Challenge | Rising Water
Aqua Alta
Aqua Alta is an interactive installation useful to explain people what would happen it the temperature will raise.
AQUA ALTA
“Rising Water” Challenge
Short Description
Aqua Alta is an interactive installation useful to explain people what would happen it the temperature will raise.
Introduction
Temperature in our planet is rising.
We all have seen Greta trying to point the attention to this in front of government and people.
We have seen our kids in our local squares collecting trash, trying to put a patch on something that is already going on.
But of course we can slow down this scenario.
We can do on our own and collectively something, and of course for first we must be aware of this.
Not everybody has in mind what does it mean.
They need something easy to understand, that can explain them the impact of one simple degree more, and more than that.
Implementation
We have decided so to work on a panel.
This panel is portable, so you can move it on every place / event you want.
This panel is done with lasercutted wood, there’s a standard monitor, and a little Arduino.
Everything at low cost, and you can build up everything easly in one of the 1500+ worldwide FabLab (https://fablabs.io/)
We have experienced in many museum that a physical interface engage more the visitors and the people passing in front of it than a touch interface, and we have seen that a table / totem installation is more valid than a smartphone app, that will be lost between hundred other apps.
So we worked on different aspects:
Were collect the data needed
we have looked between the data published by NASA, and the graphical tools released by them:
https://sealevel.nasa.gov/data/virtual-earth-syste...
https://sealevel.nasa.gov/vesl/web/sea-level/slr-e...
https://sealevel.nasa.gov/vesl/web/sea-level/slr-u...
https://sealevel.nasa.gov/data-analysis-tool
We mixed that information with other platform available online, to grab the data regarding the relationship between the world temperature raising and the sea level:
https://tidesandcurrents.noaa.gov/sltrends/sltrend...
https://sealevel.nasa.gov/data-analysis-tool
https://www.sealevels.org/#sources
https://seeing.climatecentral.org
We mixed again them with data about city and their population, area, density, and their elevation. These data are available on local specific opendata (e.g. ISTAT for Italy), but for us was simpler to use Wikipedia to access to them in the same way for every city worldwide.
https://en.wikipedia.org/wiki/
The city is choosen programmatically using the IP address of the device running the app, using public API.
What we wanted to show
Our idea is to show, in this first prototype:
population
area
density
elevation.
The city is retrieved thanks to API query related to the public IP .
The data related to the city are retrieved thanks to Wikipedia.
We retrieved the data related to sea level change related to temperature raising on the sites listed above.
Then our idea it to show how these data will change while raising the temperature.
One of the consequences of the temperature raising will be of course the raise of the sea level.
The sea level raising will of course change the topography, the habitable area and the population density. This is the first noticeable thing.
In the next version of our tool, we’d like to collect data related to:
plantation / farming
industry
viability
...
And how the sea level and temperature raising will change them together with economy, way of life, organizations, ...
How we want to show them
We have choosen a physical slider that allows people to decide how much degrees to increase.
That is at the moment the only value that a person can change.
In the next version people will be able to choose different cities.
This huge slider is connected to an Arduino, connected itself to the pc running the software.
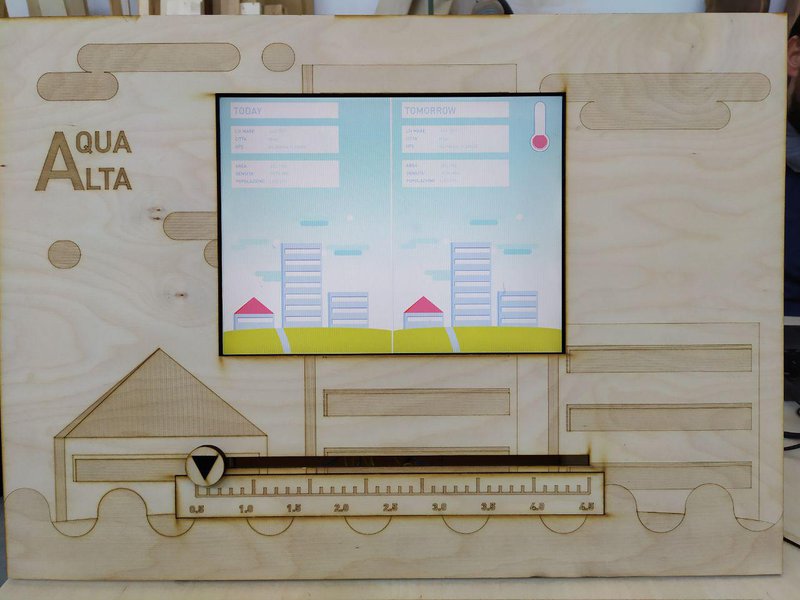
The main interface (a standard display) is divided into 2 parts:
the one in the left shows the TODAY situation (population, area, density, elevation)
the one on the left shows how the scenario will change by raising the temperature: how much will the habitable area be reduced? And how many people will be able to live there? How much will the elevation change?
(in the next version, it will be possible to know also which plantation we’ll lost or we’ll have to change, and so on)
The sea level is represented graphically relatively to the elevation of the city, and help understand better how that will affect our places.