
Water We Going To Do?| Rising Water
Project Details
The Challenge | Rising Water
Personally
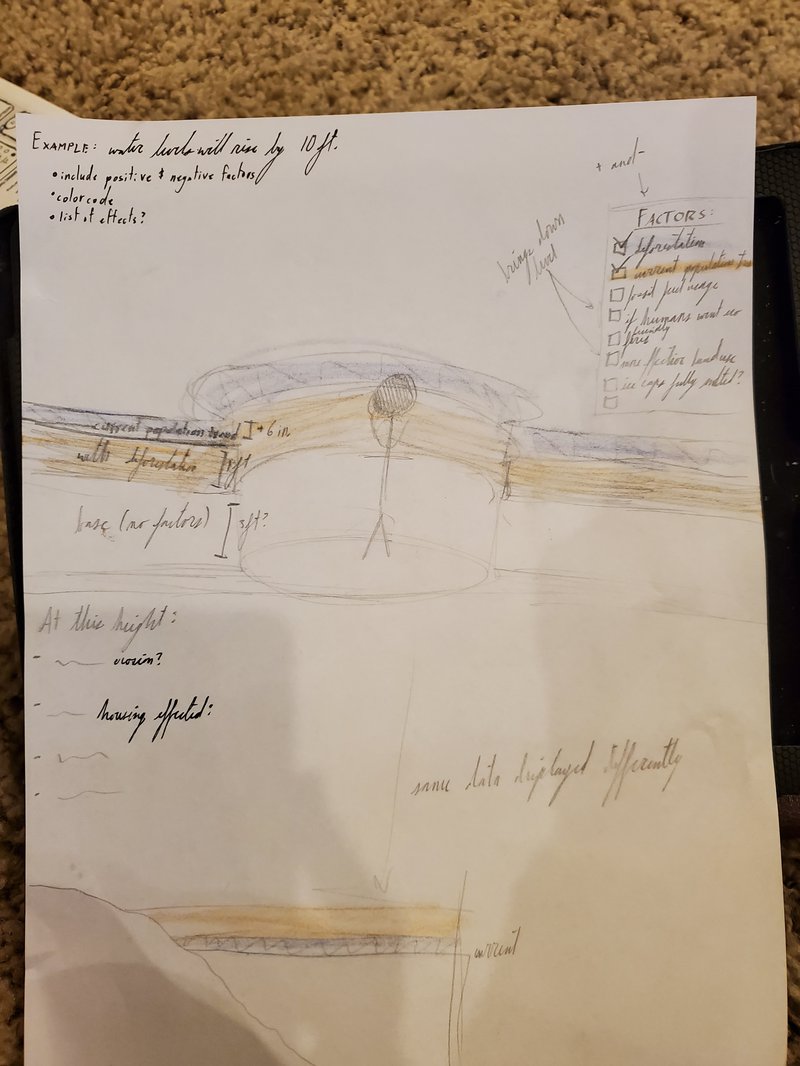
While we didn't complete our idea, the main inspiration was the video posted. The idea was to allow people to choose a time period (ex:20,30,50 years) and then select factors to add (deforestation, more recyling, etc) that would add or lessen the sea level
Background:
While I don't live near an ocean, nearly all of my family does. It's very important for them and everyone else living in costal cities to be aware of the risks of rising sea levels.
Resolution:
Having a human there next to the amount of water could really help drive home the idea of just how much the water will rise. Even if it takes a while, seeing how it can affect a person can provide a new perspective on the issue. Beyond that, it would allow people to see just how much of an impact (for example) how much the use of clean energy would lessen or at least slow the rising sea levels.
As a team, we probably could have done better communicating and getting work done. Perhaps phone numbers could have been exchanged to allow us to better contact each other. As a team, however, we came up with some really good ideas. I think we all had a blast discussing addition factors that could be added (such as the timeline for different amounts of time or the idea of various cities from around the world so that people could feel more connected to it) and how it could be improved.
NASA Resources:
We worked very hard dug through data to come up with numerical values for how much the level might rise. While we were not able to implement them into a working model, we did intend to use data from the following sources:
https://climate.nasa.gov/
https://sealevel.nasa.gov/
https://climate.nasa.gov/
https://sedac.ciesin.columbia.
https://data.nasa.gov/dataset/
We used these sites so that we could get an idea as to what areas were threatened, how fast the sea levels were rising, and what factors might be contributing to it.
Future Plans:
If we could, I'd like to spend the time developing at least a working model for how this project might work. I'd like to confer with scientists, talk with experts, and research more data to make it as accurate as possible. Even after Space Aps 2019, I plan on continuing to work on this.
Built With:
Paper, pens, pencils, and a few crayons were used to create the sketch of the project.
Tags:
#WaterWeGonnaDo #Personally #Sea Levels #Rising Water #For Fun #Environment #Oceans #Water