
Kicaco| Show the World the Data!
Project Details
The Challenge | Show the World the Data!
Visual Data 4 all (Visda)
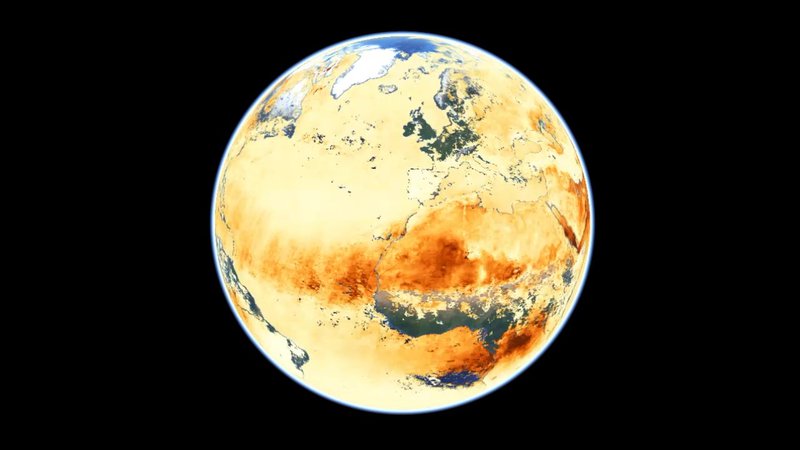
Visda app turns data from the NASA Earth Observations (NEO) service and other Web Map Services into animated visualizations. The potential of the app is to help communities with getting support for the problems they are facing using the visual data.
Our living Earth needs us now! And we as humans need a healthy earth to survive. Thanks to NASA and other organizations, who not only gather data, but also make it publicly available, we the people can create solutions for the problems we encounter. We are all in this together, lets solve it together!
Bringing factual data closer to the people and to the stakeholders who need to make decisions about the actions to be taken, we can make a step in the right direction. Visual data says more then a thousand words.
We use Nasa Earth Observatories (NEO) data which can be found at: https://neo.sci.gsfc.nasa.gov/ for our initial visualizations in our prototype. Other WMS datasets can also be used.
The Web WorldWind platform (https://worldwind.arc.nasa.gov/web/) is used to visualize the data by animating different timeframes.
Our first challenge was to go through all the challenges to filter which ones we could possibly do and which ones we could absolutely not do. After that we had a look at which of the challenges fit our passion.
Once we had chosen our project, one of our challenges was to find localized data which could be used by communities to solve the problems they encounter by deforestation, wild fires, turning mangroves into aqua culture farms, rising seawater and global warming related issues.
This would need more research. Which datasets can be used locally and what datasets can be used to visualize the effect of problems encountered.
A second problem is that we wanted to make the app user friendly but due to time constraints this was not possible. In our prototype we could only show that it is possible to make the animated visualizations from available WMS datasets to bring the data closer to the people.
To make our product a success, we would need resources to find suitable data which can really be used by the communities. We also need resources for improving the user friendliness of the app and to make it available to a wide audience. Selecting suitable datasets, selecting the available layers in a dataset and setting timeframes, downloading the animation as a video file, etc. could all be improvement made. The functionality could also be integrated in existing data visualization tools like on the NEO website for the NEO dataset.
If there are researcher/scientists, Local Government Units, Non Government organizations, communities near Bacolod City who need visual data to communicate with their stakeholders, please contact us. We are looking for a partner for a pilot project.Our thanks goes to the global Nasa Space App Organization, the resource speakers and all the local organizers to make this an inspirational and exciting event with lots of opportunities to learn.