
Hotpoprobot| Smash your SDGs!
Project Details
Awards & Nominations
Hotpoprobot has received the following awards and nominations. Way to go!
The Challenge | Smash your SDGs!
Schools and NASA Aiding Climate action by Kids (S.N.A.C.K.)
School Strikes for Climate has shown students want action on climate change. My project uses satellite imagery to rank schools based on their tree densities and maps them. Students can add and share picture of school trees to make their schools greener.
Project S.N.A.C.K: From School Climate Strikes to School Climate Action
I and my school friends participated in School Strike for Climate in Toronto. Thousands of schools worldwide participated in the strike motivated by Swedish Youth Climate Activist Greta Thunberg.
But I wanted to do more than just raise slogans.
I wanted school children to come up with local solutions to global challenges. So I started thinking of ways to make my school and city greener.(SDG Goal 11: Sustainable Cities and Communities)
As school playgrounds are small and their tree densities are less than 20% they usually do not figure out in city green cover maps.But it is important to measure and monitor school tree densities as they are used the most by children.
So I created project S.N.A.C.K (Schools and NASA aiding Climate action by Kids) to measure tree densities for 15 french-board schools in Toronto.
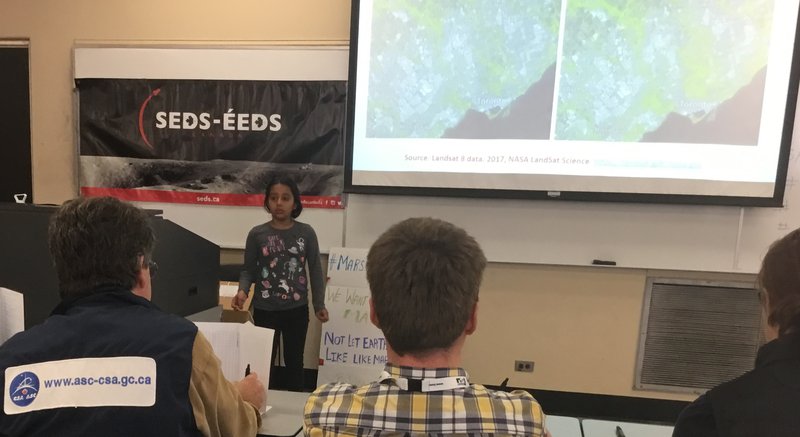
1. I used vegetation data from the NASA Satellite Data (LandSat 8) and i-Tree Canopy Tool provided free of charge by USDA Forest Service to measure the tree canopy area within the school boundary.
2. I ranked the schools according to their tree densities and the climate benefits provided by the trees and mapped them on a crowdsourcing platform. Students can check tree densities of their schools and also submit pictures of trees they are planting to make their schools greener.
3. The crowd map of School Tree data can be viewed at: http://snack.ushahidi.ioYou can add data too!
4. In addition, I built a pollution sensor in my home using Arduino to measure air quality. I used my Sensor at schools and at busy street intersections to measure the impact of trees in absorbing air pollutants and making our air cleaner.
Some children have started using this project. As more and more school children participate in this project, we can create a crowd map of school parks and their tree densities.
This action by school students will play an important role in moving from School Strikes to School Action on Climate Change.
Resources Used:
1. NASA Landsat 8 Imagery
https://landsat.visibleearth.nasa.gov/ and https://worldview.earthdata.nasa.gov
2. i-Tree Canopy Tool from USDA Forest Service
3. Arudino and Grove - Dust Sensor