
Breeze Technologies | Surface-to-Air (Quality) Mission
Project Details
Awards & Nominations
Breeze Technologies has received the following awards and nominations. Way to go!
The Challenge | Surface-to-Air (Quality) Mission
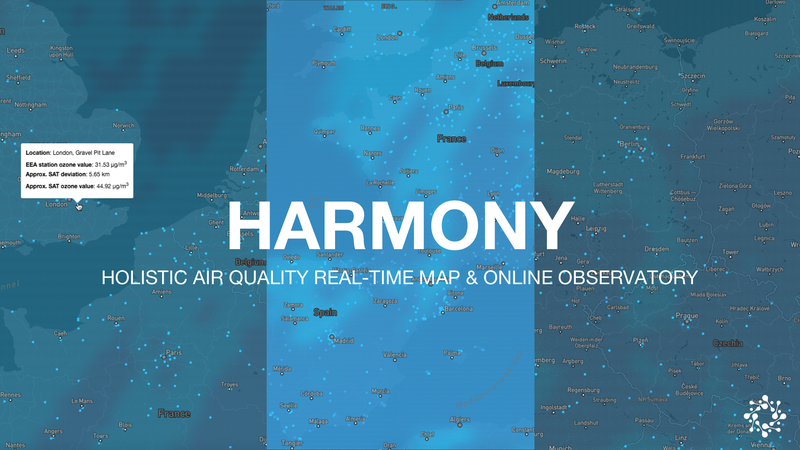
HARMONY - Holistic Air quality Real-time Map and ONline observatorY
Breeze Technologies has developed an environmental intelligence map that allows the near real-time monitoring of indicative satellite air quality data and an evaluation of satellite data quality in comparison to public air quality monitoring stations.
How can we gain a realistic picture of Air Quality (AQ) in our cities? How can we evaluate satellite data quality?
The number of the existing surface air quality monitoring stations of the local authorities is insufficient and the traditional evaluation techniques are very expensive. This means that traditional air quality monitoring stations are often kilometres apart; providing data that is neither geospatially relevant, nor available in real-time or in a comprehensible form. For citizens, it is almost impossible to get complete and accurate AQ information for their neighbourhood.
Earth observation data from satellites has the potential to improve data availability by predicting pollution levels to overcome these measurement gaps. However, surface data needs to be used to recalibrate and improve the earth observation (EO) data.
A combination of both ground-based and satellite-based air quality monitoring data can be a powerful tool to validate and monitor air quality on a large scale in cities world-wide. This is why we have created HARMONY (the Holistic Air quality Real-time Map and ONline observatorY).
Breeze Technologies' HARMONY provides a complete overview of the current air quality and pollution concentration in Europe, based on municipal monitoring stations and earth observation data from NASA and ESA. Additionally, HARMONY enables researchers to identify data offsets between satellite data and ground-based monitoring stations to provide the means for further data calibration.
Challenges in preparing the data:
- Data sophistication:
- Ozone data is only available as vertical gas column, not as height-layered profiles
- Distribution of ozone molecules can differ along with the different tropospheric layers
- Data processing:
- Transform data sets from earth observation and surface data to a uniform time scale
- Transform values of the different datasets to comparable and evaluable units
- Find the right APIs for our purposes
- Comprehension of different data formats
- Complex technical documentation of the APIs
Main features of HARMONY:
- Our solution allows the scientific near real-time monitoring and evaluation of indicative AQ data of satellites on an interactive heat-map.
- Calculated hourly values from satellite data can be compared with municipal monitoring stations in order to determine the absolute data quality for the respective measurement locations.
- Historical data can be compared with respect to trends and progressions to determine the relative data quality of a measurement period
- Offsets can be detected in addition to the mere deviation of the height of the measured values. This information can be used to update and continuously improve the algorithms of the satellite data.
Value Proposition for Users
Users of the map will receive real-time, hyperlocal and accurate AQ data of their neighbourhood. Like that, they can make better decisions with regards to traffic use, outdoor sports, preferred living areas and many more.
Value Proposition for Science
The unrestricted availability of data enables completely new scenarios and use cases. For example, there have been few measurements of ozone concentration over the oceans to investigate the relationship between ozone and NO in ozone depletion. With our solution, we can now support the thesis that ozone is genuinely higher at sea than in urban regions (same context as in rural regions) because there are no local NO emitters.
What data is Breeze Technologies using?
- We use common air quality standards (in this case according to the EU Directive, as we also use EEA measurement data) to evaluate the measurement data.
- In order to ensure that data aggregation fits the evaluation standard (it would not be scientifically permissible, for example, to evaluate hourly averages with a daily AQI), we have opted for a parameter (ozone - O3) for which we receive the hourly averages from both the official monitoring stations and satellites, therefore being able to evaluate them with an hourly AQI.
- In order to be able to compare the data at all, it was important that we get an indication of the concentration for ground-level ozone from the satellite data. Since ozone can vary over the individual layers of the tropospheric and stratospheric column, we decided against the measurement data of the entire column and chose ground-level (0 meters) data. This enabled us to compare it with the official measurements on the surface.
Tools, Frameworks and Platforms used
- Python
- NodeJS
- Docker
- Mapbox
- Microsoft Azure
Software architecture

What will we do next?
Breeze Technologies will be working on extending HARMONY:
- Integration of more air quality parameters like nitrogen dioxide (NO2) and particulate matter (PM10, PM2.5, etc.)
- Possibility to generate heat-maps based on the delta between satellite data and ground-based data to quickly identify where satellite calibration might be necessary
- Quality-of-life and accessibility tools like menus for historical data selection
Stay in touch and observe our progress here: https://www.breeze-technologies.de/.
Resources
- https://api.nasa.gov/#browseAPI
- https://s5phub.copernicus.eu/dhus/#/home
- https://www.regional.atmosphere.copernicus.eu/
- https://earthdata.nasa.gov/earth-observation-data/near-real-time/hazards-and-disasters/air-quality
- https://www.opengeospatial.org/standards/wcs
- https://www.epa.gov/hesc/web-access-rsig-data
- https://atmosphere.copernicus.eu/ozone-layer-and-ultra-violet-radiation
Try it out - link to HARMONY
Tags
#machine learning, #artificial intelligence, #javascript, #earth science, #air quality, #python, #nodeJS, #GIS