
Comet me bro| Surface-to-Air (Quality) Mission
Project Details
The Challenge | Surface-to-Air (Quality) Mission
Your challenge is to integrate NASA data, ground-based air quality data, and citizen science data to create an air quality surface that displays the most accurate data for a location and time. Create algorithms that select or weight the best data from several sources for a specific time and location, and display that information.
MonitAir
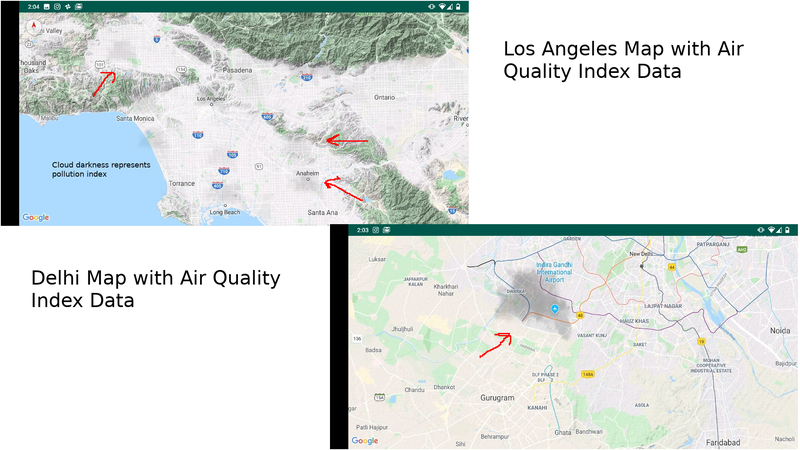
Data visualization all from different sources combined into a single index which is then passed onto the (supposedly) user friendly android app
1. Us:
- 5 Techonology Geeks
- AllSoftware developers
2. The project
- Mainly focused on minimalistic UI for visualization of data
- We'll keep updating it with interesting and creative facts to give the user a "fun while learning" vibe
3.Workflow
- From the given data. We remove missing and out of range values (can maybe implement imputation techniques or the EM algo)
- A python script watches the current directory and processes newly added files which conform to its data formatting.
- All the pollutant data is then averaged over 24hr and then we calculate the air quality index based on the classic formula (we'll update references and publish the maths after a big long nap)
- All of this is then updated in the folder watched by the php script. The previous data gets moved into a history log.
- API can deliver the latest 5 readings for a present location, latest 1 reading and all the readings by far in the history log(not optimized at all xD)
4. Future prospects
- The Sentinel 5p has the exact targeted data needed for complete AQI calculation. Just need a script to get that data regularly and away we go.
- Redundant data can be eliminated easily for visualkzation purposes but for research we need to look at much more "Science" data.